


Mizuho Financial Group Inc Stock (MFG) Moved Down by 3.04% on Apr 2: What Investors Need To Know
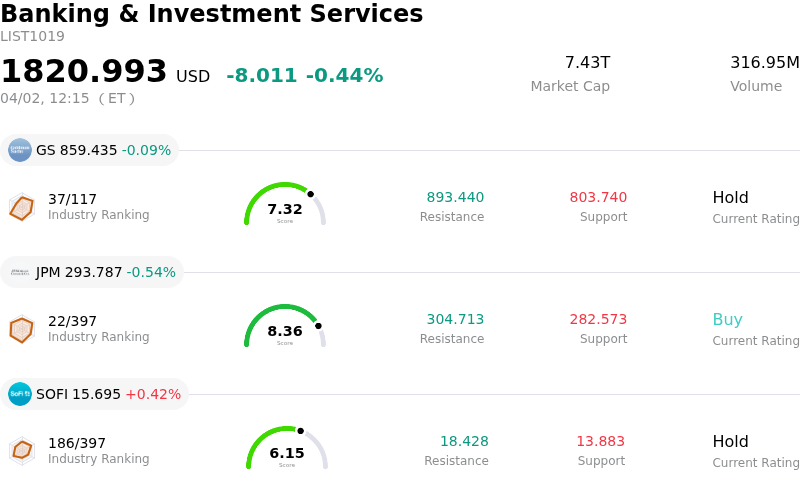
Mizuho Financial Group Inc (MFG) moved down by 3.04%. The Banking & Investment Services sector is down by 0.44%. The company underperformed the industry. Top 3 stocks by turnover in the sector: Goldman Sachs Group Inc (GS) down 0.09%; JPMorgan Chase & Co (JPM) down 0.54%; SoFi Technologies Inc (SOFI) up 0.42%.
What is driving Mizuho Financial Group Inc (MFG)’s stock price down today?
The downward movement and significant intraday volatility observed in MFG's stock today are primarily attributable to escalating geopolitical tensions and a cautious global market sentiment, which are exerting pressure on the financial sector. Broad market jitters, particularly stemming from the ongoing U.S.-Iran conflict and statements by President Trump concerning potential strikes on Iran, have led to widespread sell-offs across various asset classes. This heightened geopolitical uncertainty is unsettling global markets, causing Asian equities to trade lower and resulting in surges in Brent Crude oil prices, both of which negatively impact market stability.
The broader financial sector, including Japanese banks like Mizuho Financial Group, is experiencing headwinds from these macroeconomic factors and the surging oil prices. Market sentiment has also been affected by the full pricing out of rate cut expectations for the year 2026, contributing to a general retreat in financial stocks. This macro environment appears to be overshadowing any positive company-specific developments.
While Mizuho Financial Group recently reported an earnings per share beat in its third-quarter 2026 results announced in early February, it also noted a significant revenue miss. Furthermore, short interest in the company's stock experienced a substantial increase in early March, indicating a growing bearish outlook from some investors. Despite recent positive recognition for its corporate banking services in the U.S. in mid-March, these broader market concerns and underlying financial indicators are currently weighing on the stock's performance.
Technical Analysis of Mizuho Financial Group Inc (MFG)
Technically, Mizuho Financial Group Inc (MFG) shows a MACD (12,26,9) value of [-0.24], indicating a neutral signal. The RSI at 56.68 suggests neutral condition and the Williams %R at -5.62 suggests oversold condition. Please monitor closely.
Fundamental Analysis of Mizuho Financial Group Inc (MFG)
Mizuho Financial Group Inc (MFG) is in the Banking & Investment Services industry. Its latest annual revenue is $20.46B, ranking 28 in the industry. The net profit is $4.07B, ranking 28 in the industry. Company Profile
Over the past month, multiple analysts have rated the company as Strong Buy, with an average price target of $9.70, a high of $9.70, and a low of $9.70.
More details about Mizuho Financial Group Inc (MFG)
Company Specific Risks:
- Mizuho Financial Group (MFG) reported a significant revenue miss in its most recent quarterly earnings, despite an EPS beat, which suggests potential challenges with its top-line performance.
- Investor sentiment for MFG has deteriorated, evidenced by a substantial 83.3% increase in short interest, contributing to recent stock price declines due to ongoing selling pressure.
- The company's rate-sensitive earnings outlook is vulnerable to current global macroeconomic headwinds, including escalating Middle East geopolitical tensions driving oil prices higher and rising Treasury yields, which are broadly weighing on financial sector stocks.
- MFG's stock has experienced a notable 19% decline over the past 30 days driven by technical selling pressure, indicating sustained negative market perception and potentially exposing fundamental business weaknesses.
Recommended Articles


