


Is This The Bitcoin Bottom? 3 Metrics Still Point To $63,000 As The Key Risk Zone

The Bitcoin price has seen one of its sharpest pullbacks in months, losing over 11% since its late-January peak. While the price has reached a major technical target, on-chain and derivatives data suggest the market may not be done correcting.
With buyers still cautious and whales reducing exposure, the question now is simple: is this the bottom, or just another stop on the way lower?
Bitcoin Hit Its Breakdown Target After Pattern Failure
Bitcoin’s recent decline followed a clear technical roadmap.
In late January, the price broke below a head-and-shoulders pattern, confirming a bearish reversal. The breakdown on January 29 projected a downside target near $75,130. By early February, Bitcoin had reached this zone, validating the pattern almost perfectly.
Want more token insights like this? Sign up for Editor Harsh Notariya’s Daily Crypto Newsletter here.
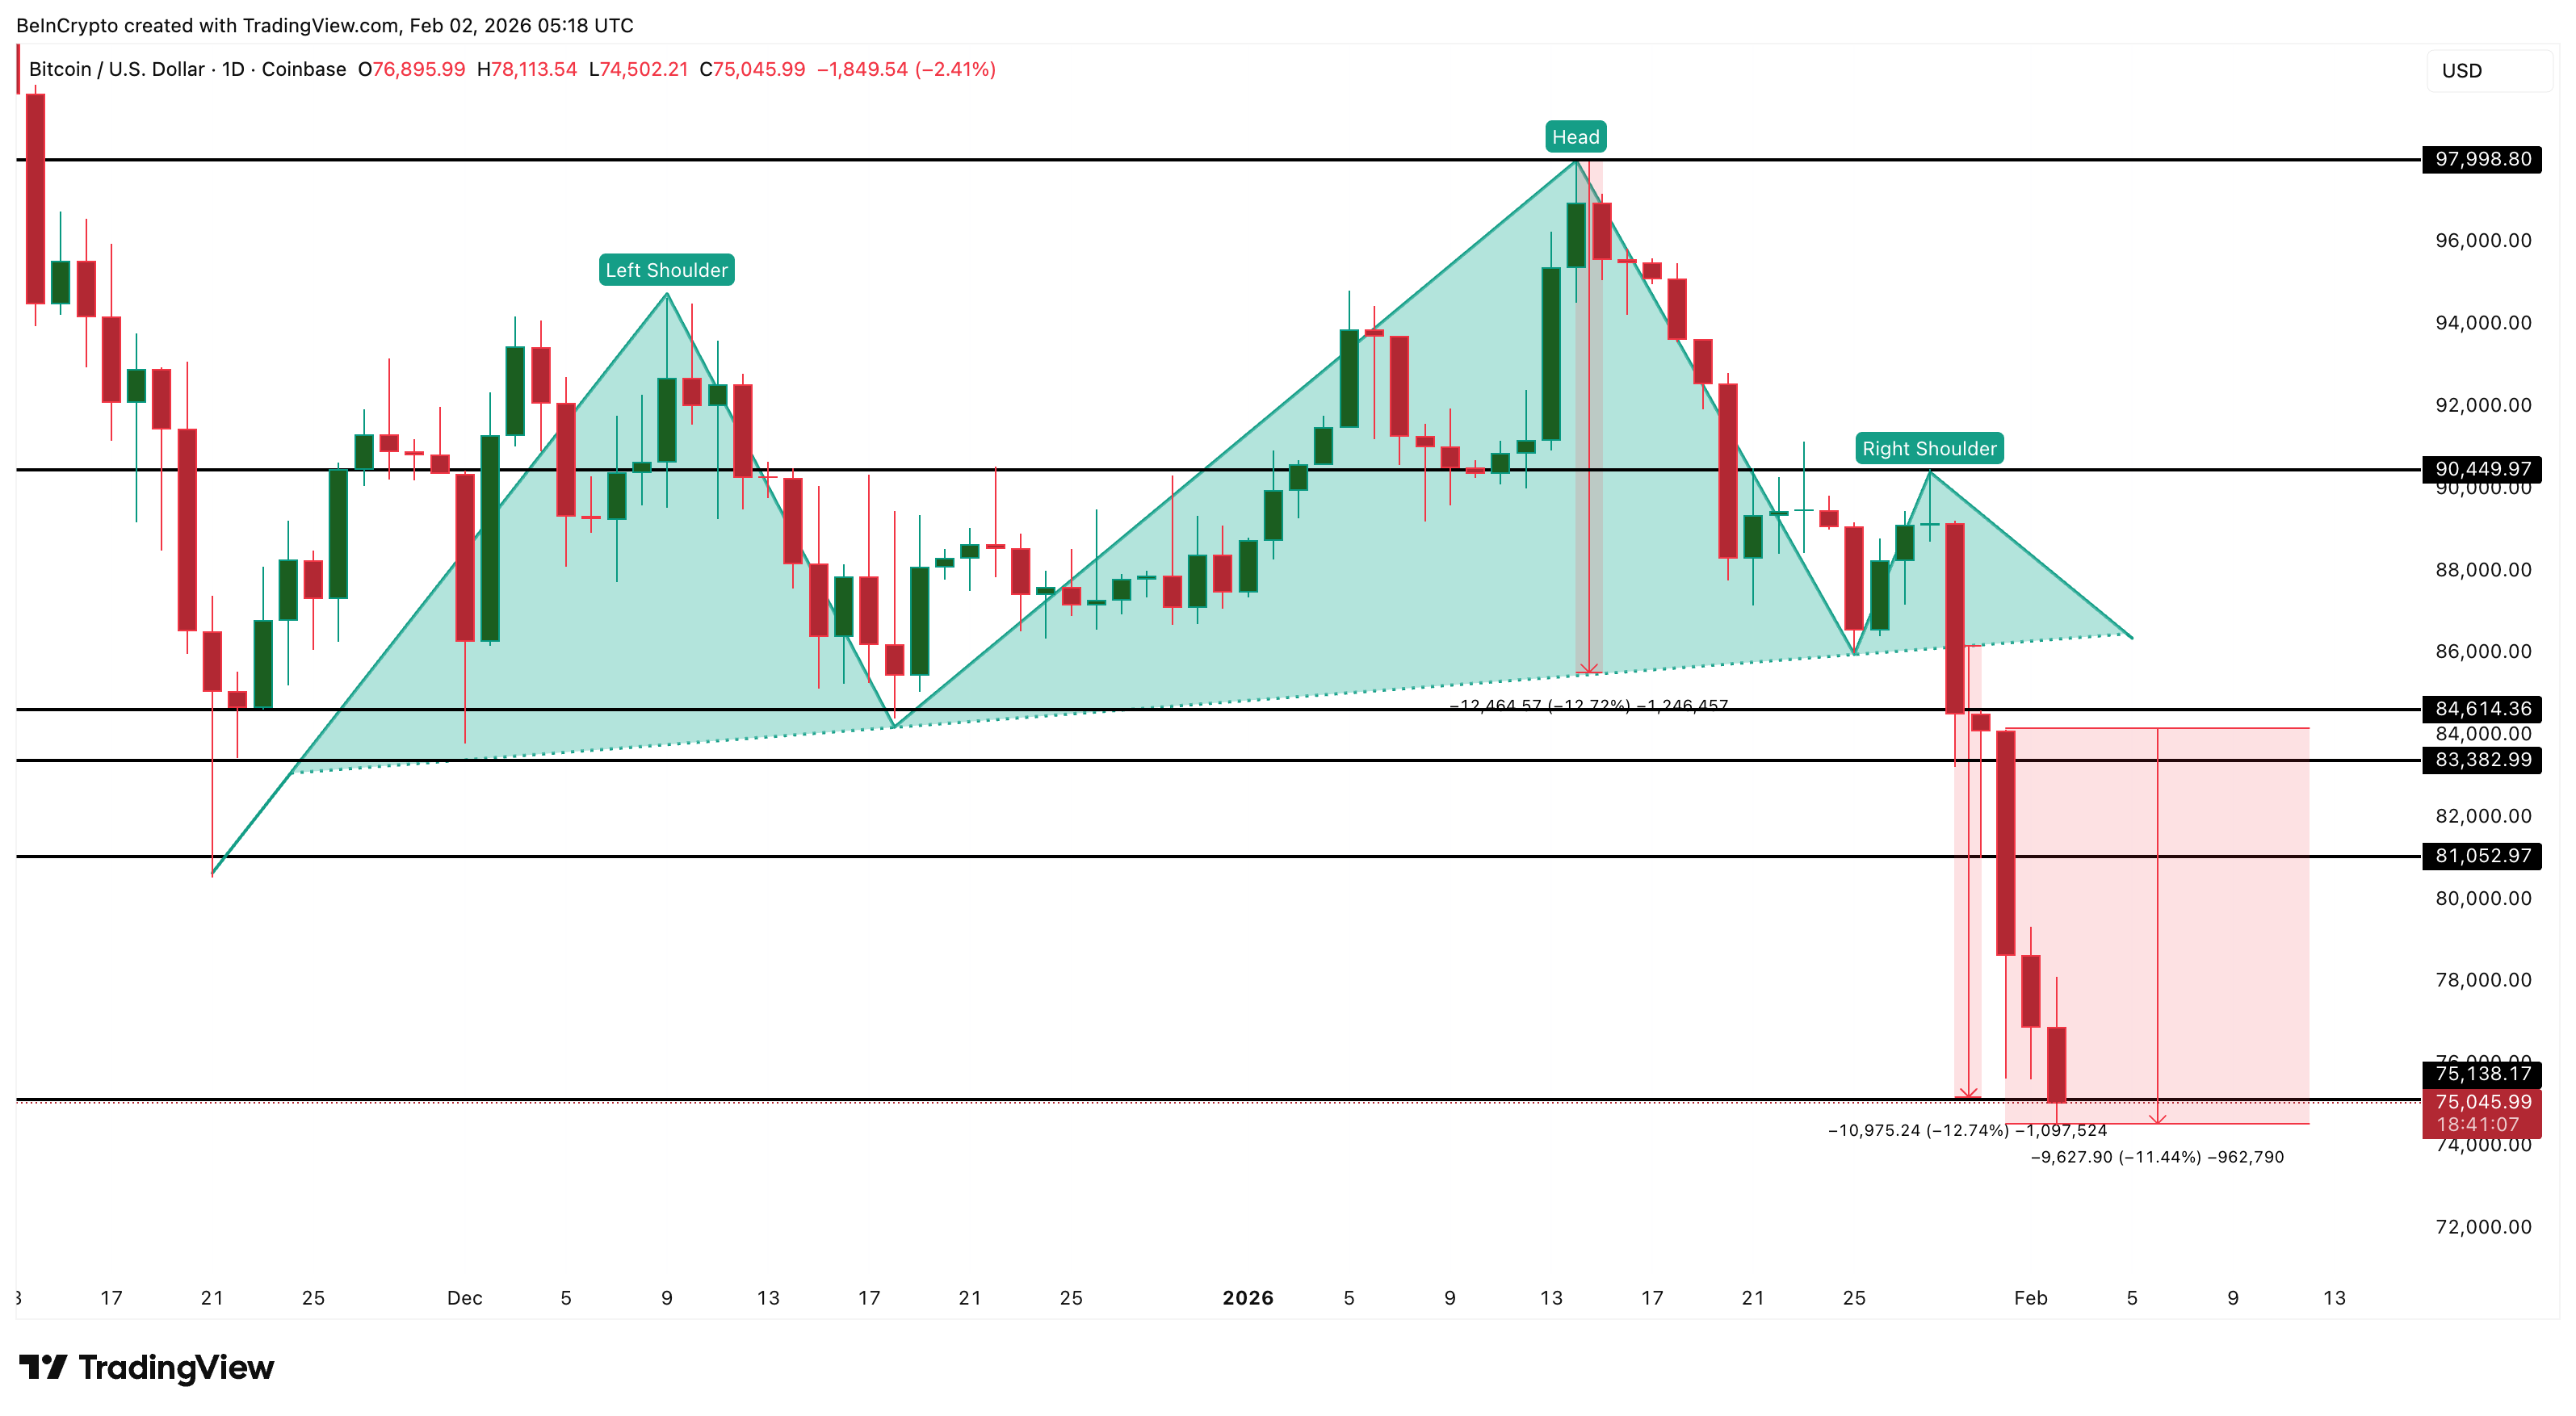
Since January 31, Bitcoin has corrected by nearly 11%, falling from its local high to the $75,000 range. This move triggered widespread liquidations and dragged the broader crypto market lower.
Reaching a breakdown target often brings short-term relief. However, it does not guarantee a durable bottom. Whether this level holds depends on how buyers respond after the technical damage.
So far, that response has been weak.
Spot Buyers Are Still Missing at Key Support Levels
One of the biggest warning signs is the lack of strong accumulation near $75,000.
Exchange outflows, which track how much Bitcoin is being moved off trading platforms into long-term storage, have fallen sharply. Around January 31, outflows stood near 42,400 BTC. After the sell-off, they dropped to about 14,100 BTC, a decline of nearly 67%.
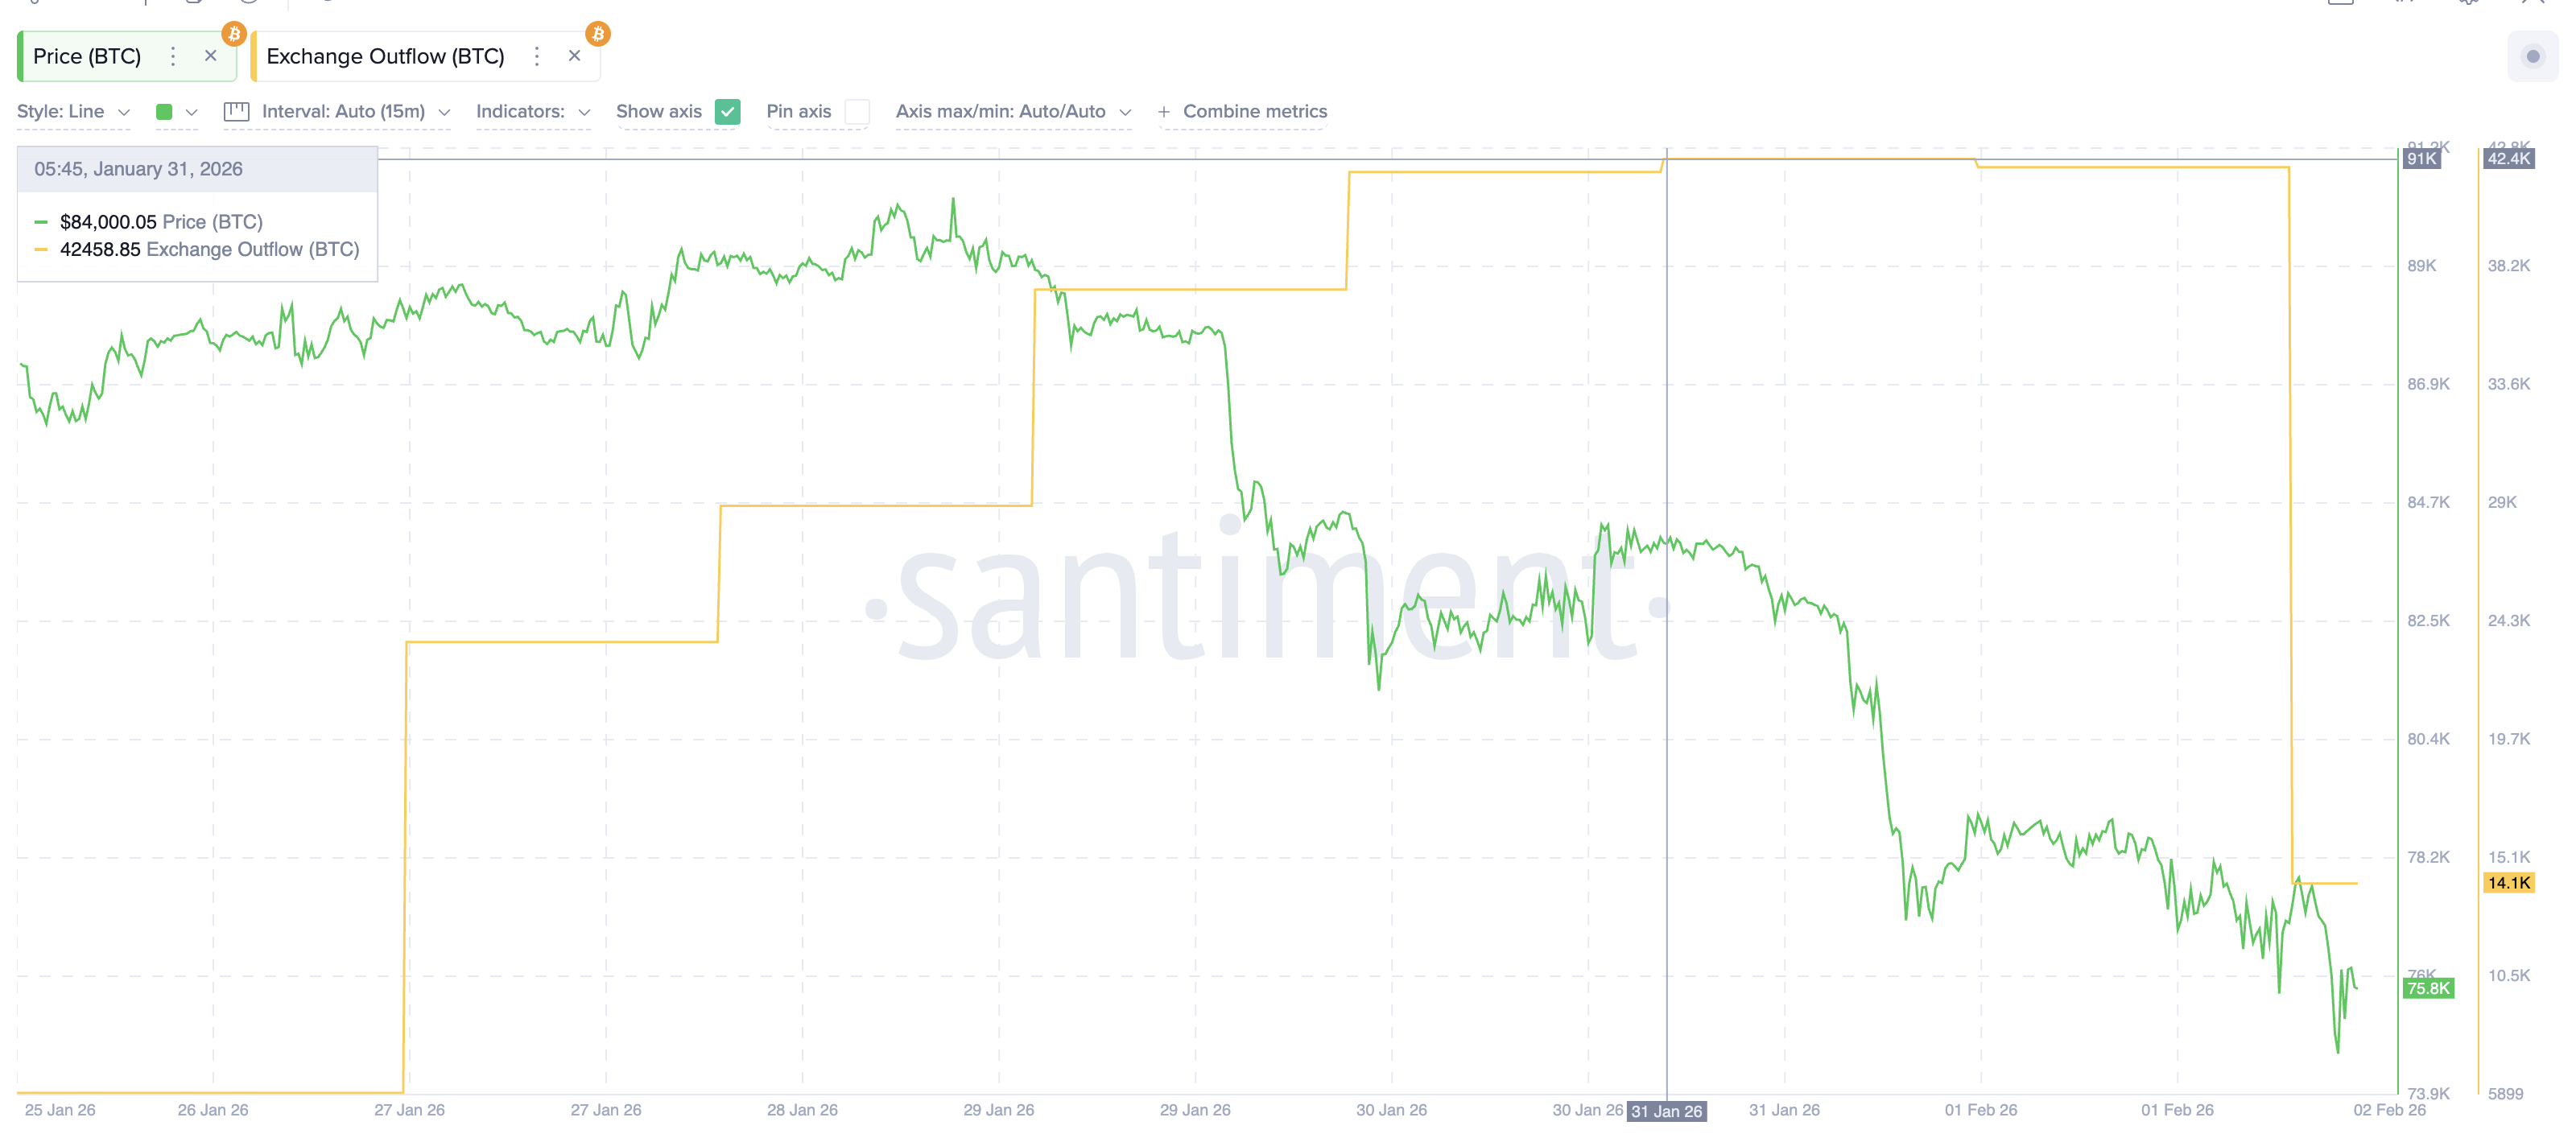
This suggests investors are not rushing to buy the dip. That’s the first warning metric.
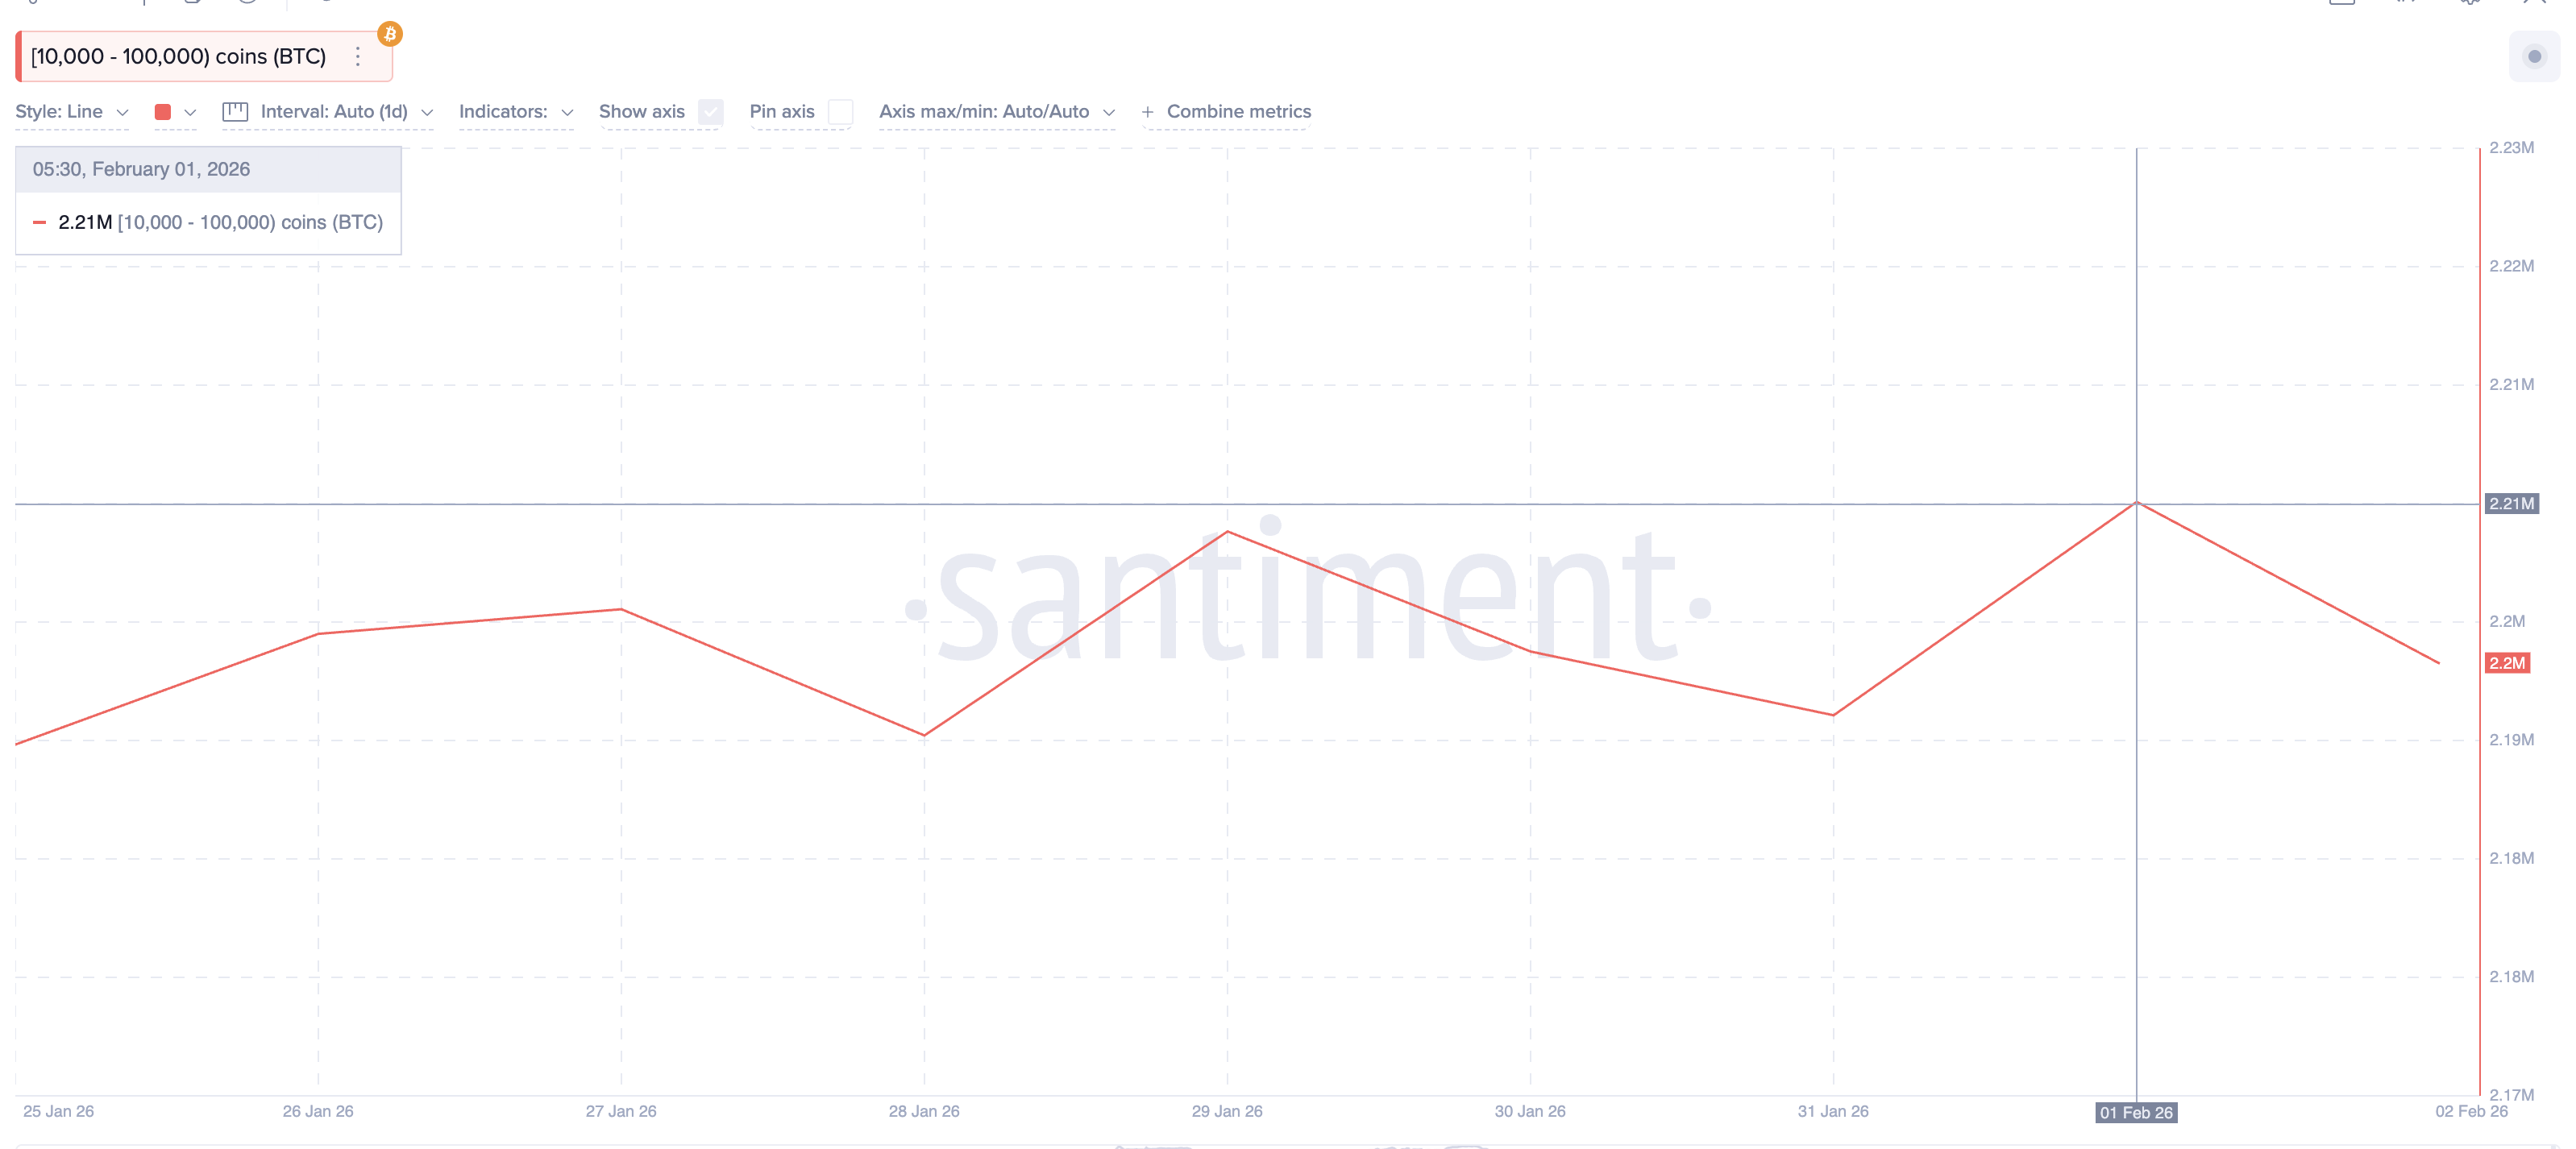
Whale behavior adds to the concern as the second warning metric. Wallets holding between 10,000 and 100,000 BTC have been reducing exposure since February 1. Their combined holdings fell from around 2.21 million BTC to 2.20 million BTC. That represents roughly 10,000 BTC sold, worth about $750 million near current prices.
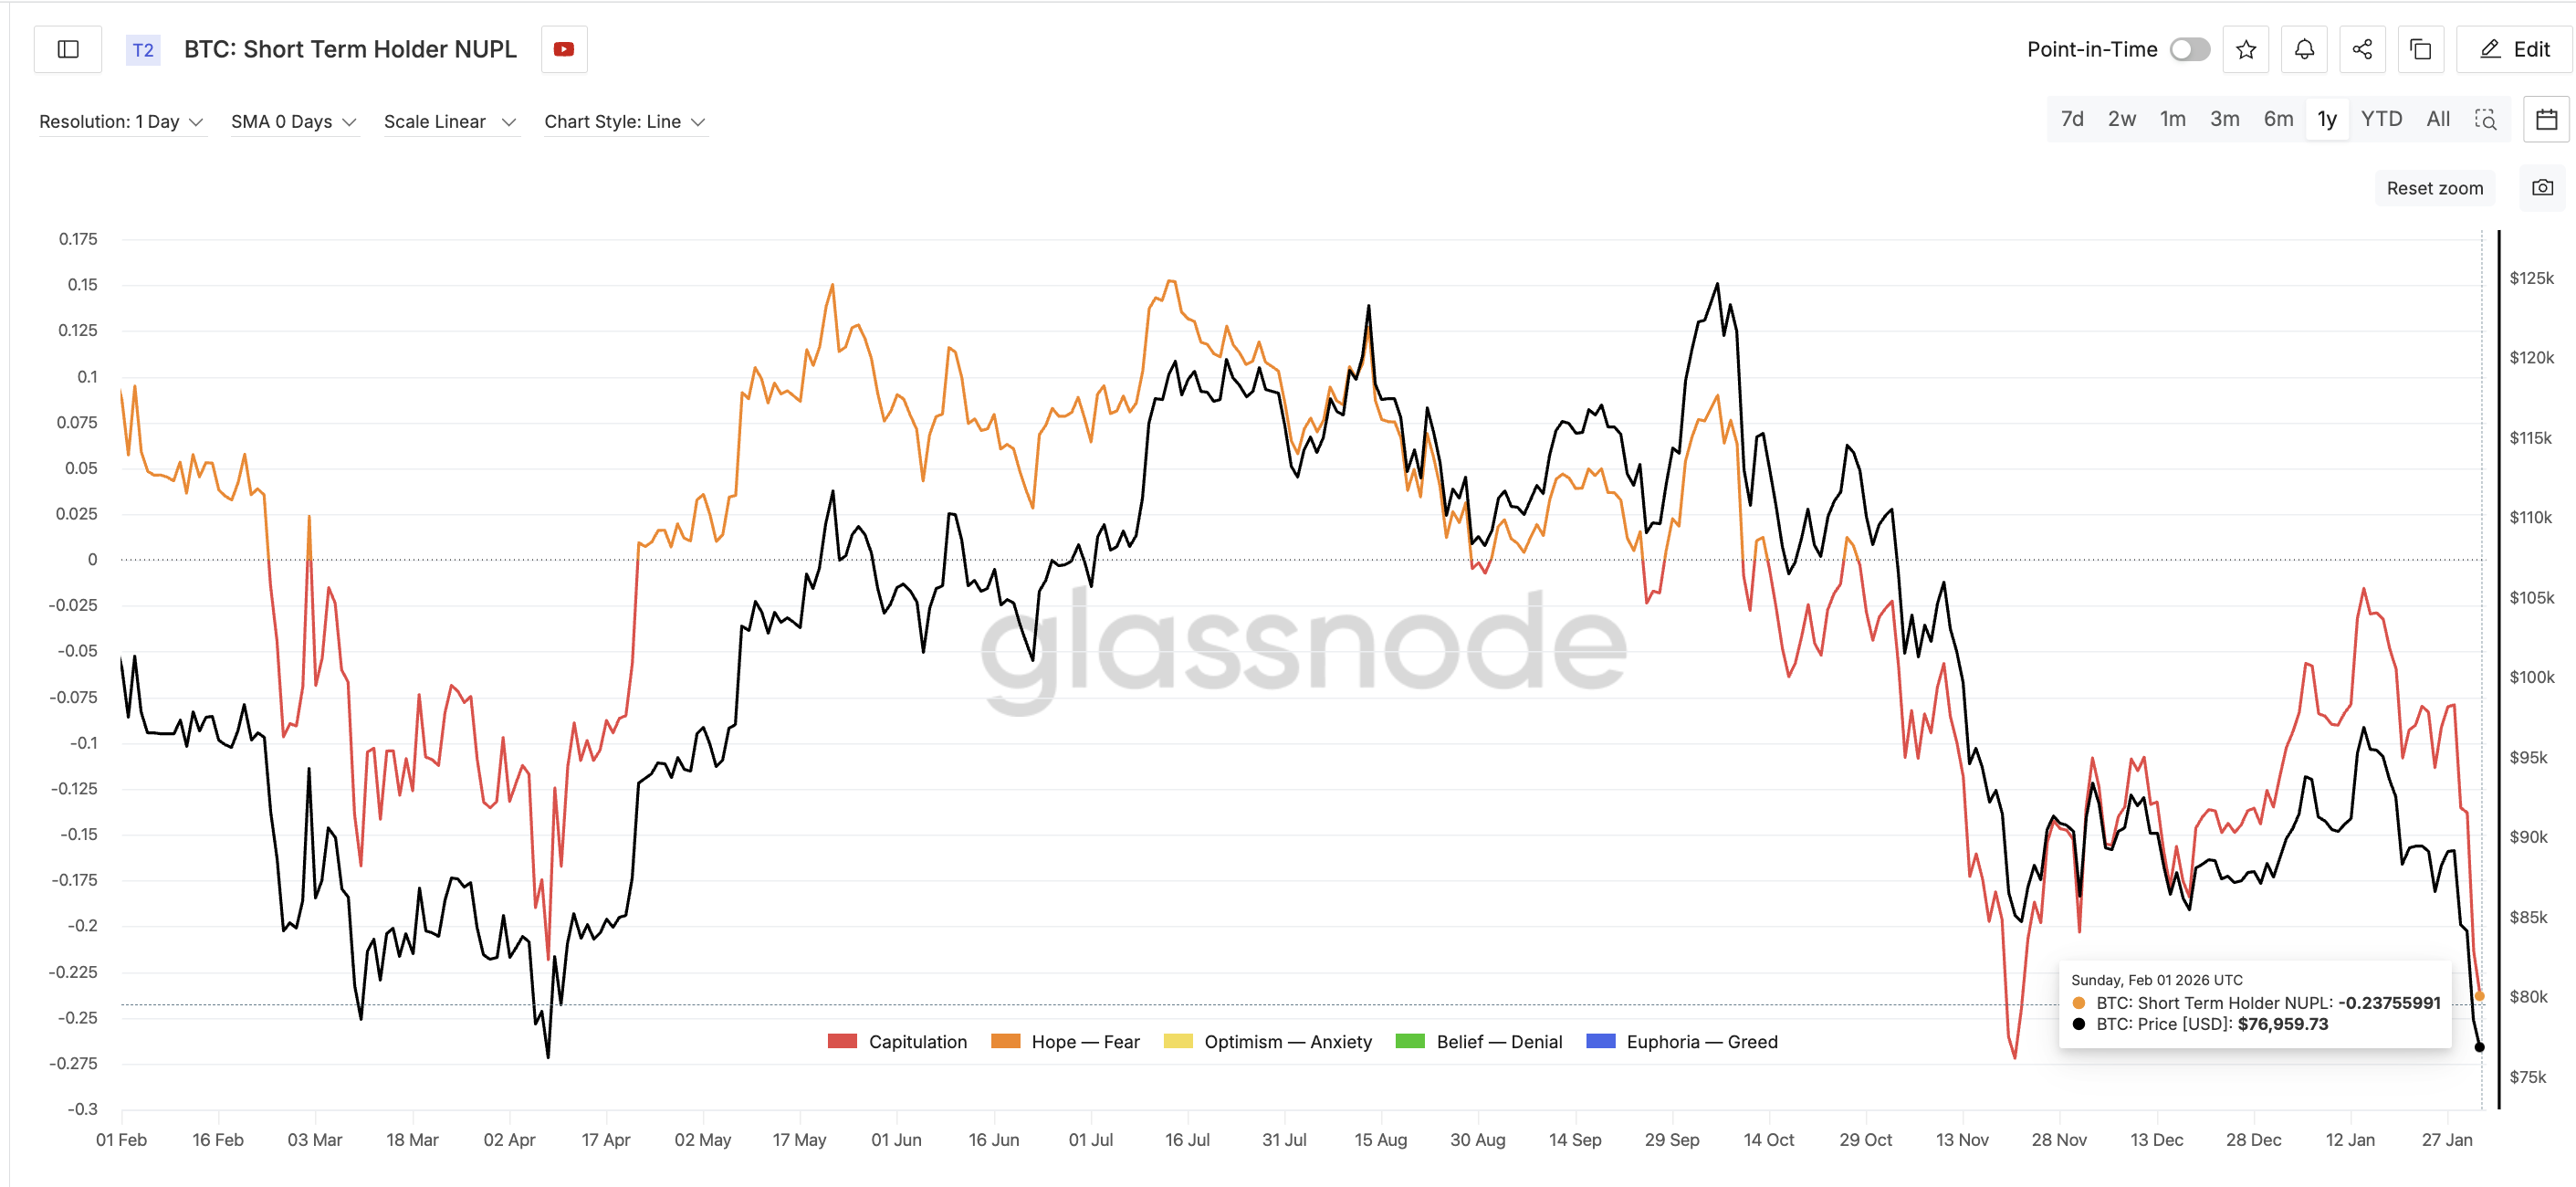
Short-term holder NUPL (Net Unrealized Profit/Loss), which measures whether recent buyers are in profit or loss, is also flashing caution as the third metric. NUPL currently sits near -0.23, placing traders in the capitulation zone. However, during the November bottom, NUPL fell to around -0.27 before a strong rebound began. This shows panic is present, but not as extreme, hinting at a delayed bottom.
Together, falling outflows, whale selling, and incomplete capitulation suggest conviction remains weak.
Derivatives Show Heavy Short Positioning, Not Strong Demand
With spot buyers staying cautious, derivatives markets have become the main source of potential upside.
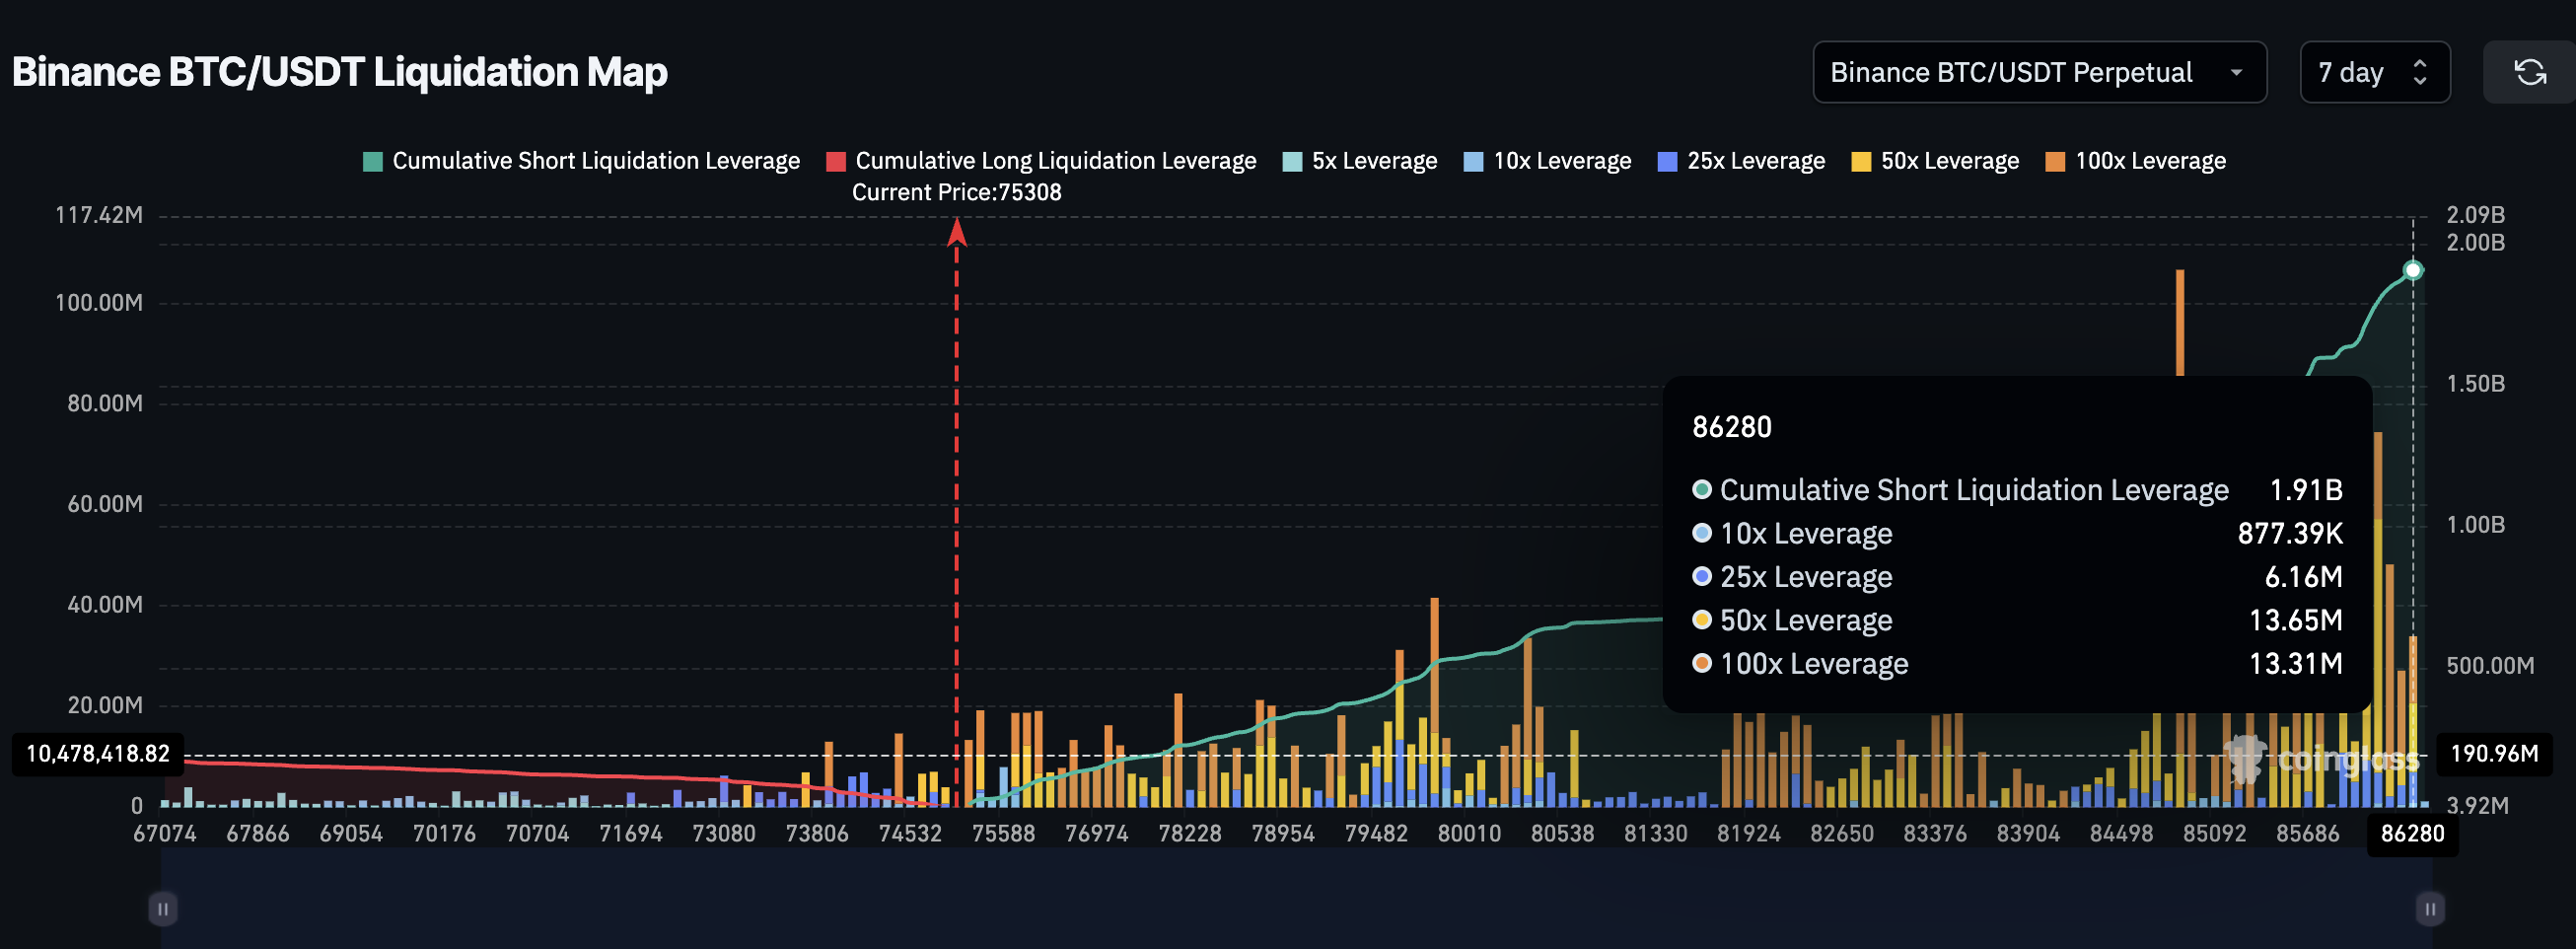
Liquidation data from Binance shows cumulative short leverage near $1.91 billion, while long positions have fallen to around $168 million. This creates a massive imbalance in favor of bearish bets.
When short positions become crowded, even small rallies can trigger forced buying. If Bitcoin rises, short sellers are pushed to close positions, which can fuel sharp rebounds. This creates the possibility of a short squeeze.
However, this is not the same as healthy demand. A rally driven by liquidations tends to fade unless supported by real accumulation. Without stronger spot buying and whale participation, any upside may remain temporary. This is due to the fact that once the possible short squeeze drives the prices up, more long positions could open, keeping downside risks alive.
For now, derivatives offer volatility, not stability. What the BTC price actually needs is spot demand, which is missing at present.
Key Bitcoin Price Levels Point to $69,000 and Lower Risk Zones
If Bitcoin fails to hold its current support, on-chain and technical models highlight clear downside targets.
UTXO Realized Price Distribution (URPD) shows where the existing Bitcoin supply was last purchased. These clusters often act as support during declines.
The strongest near-term URPD cluster sits near $66,890, where about 0.95% of supply is concentrated.
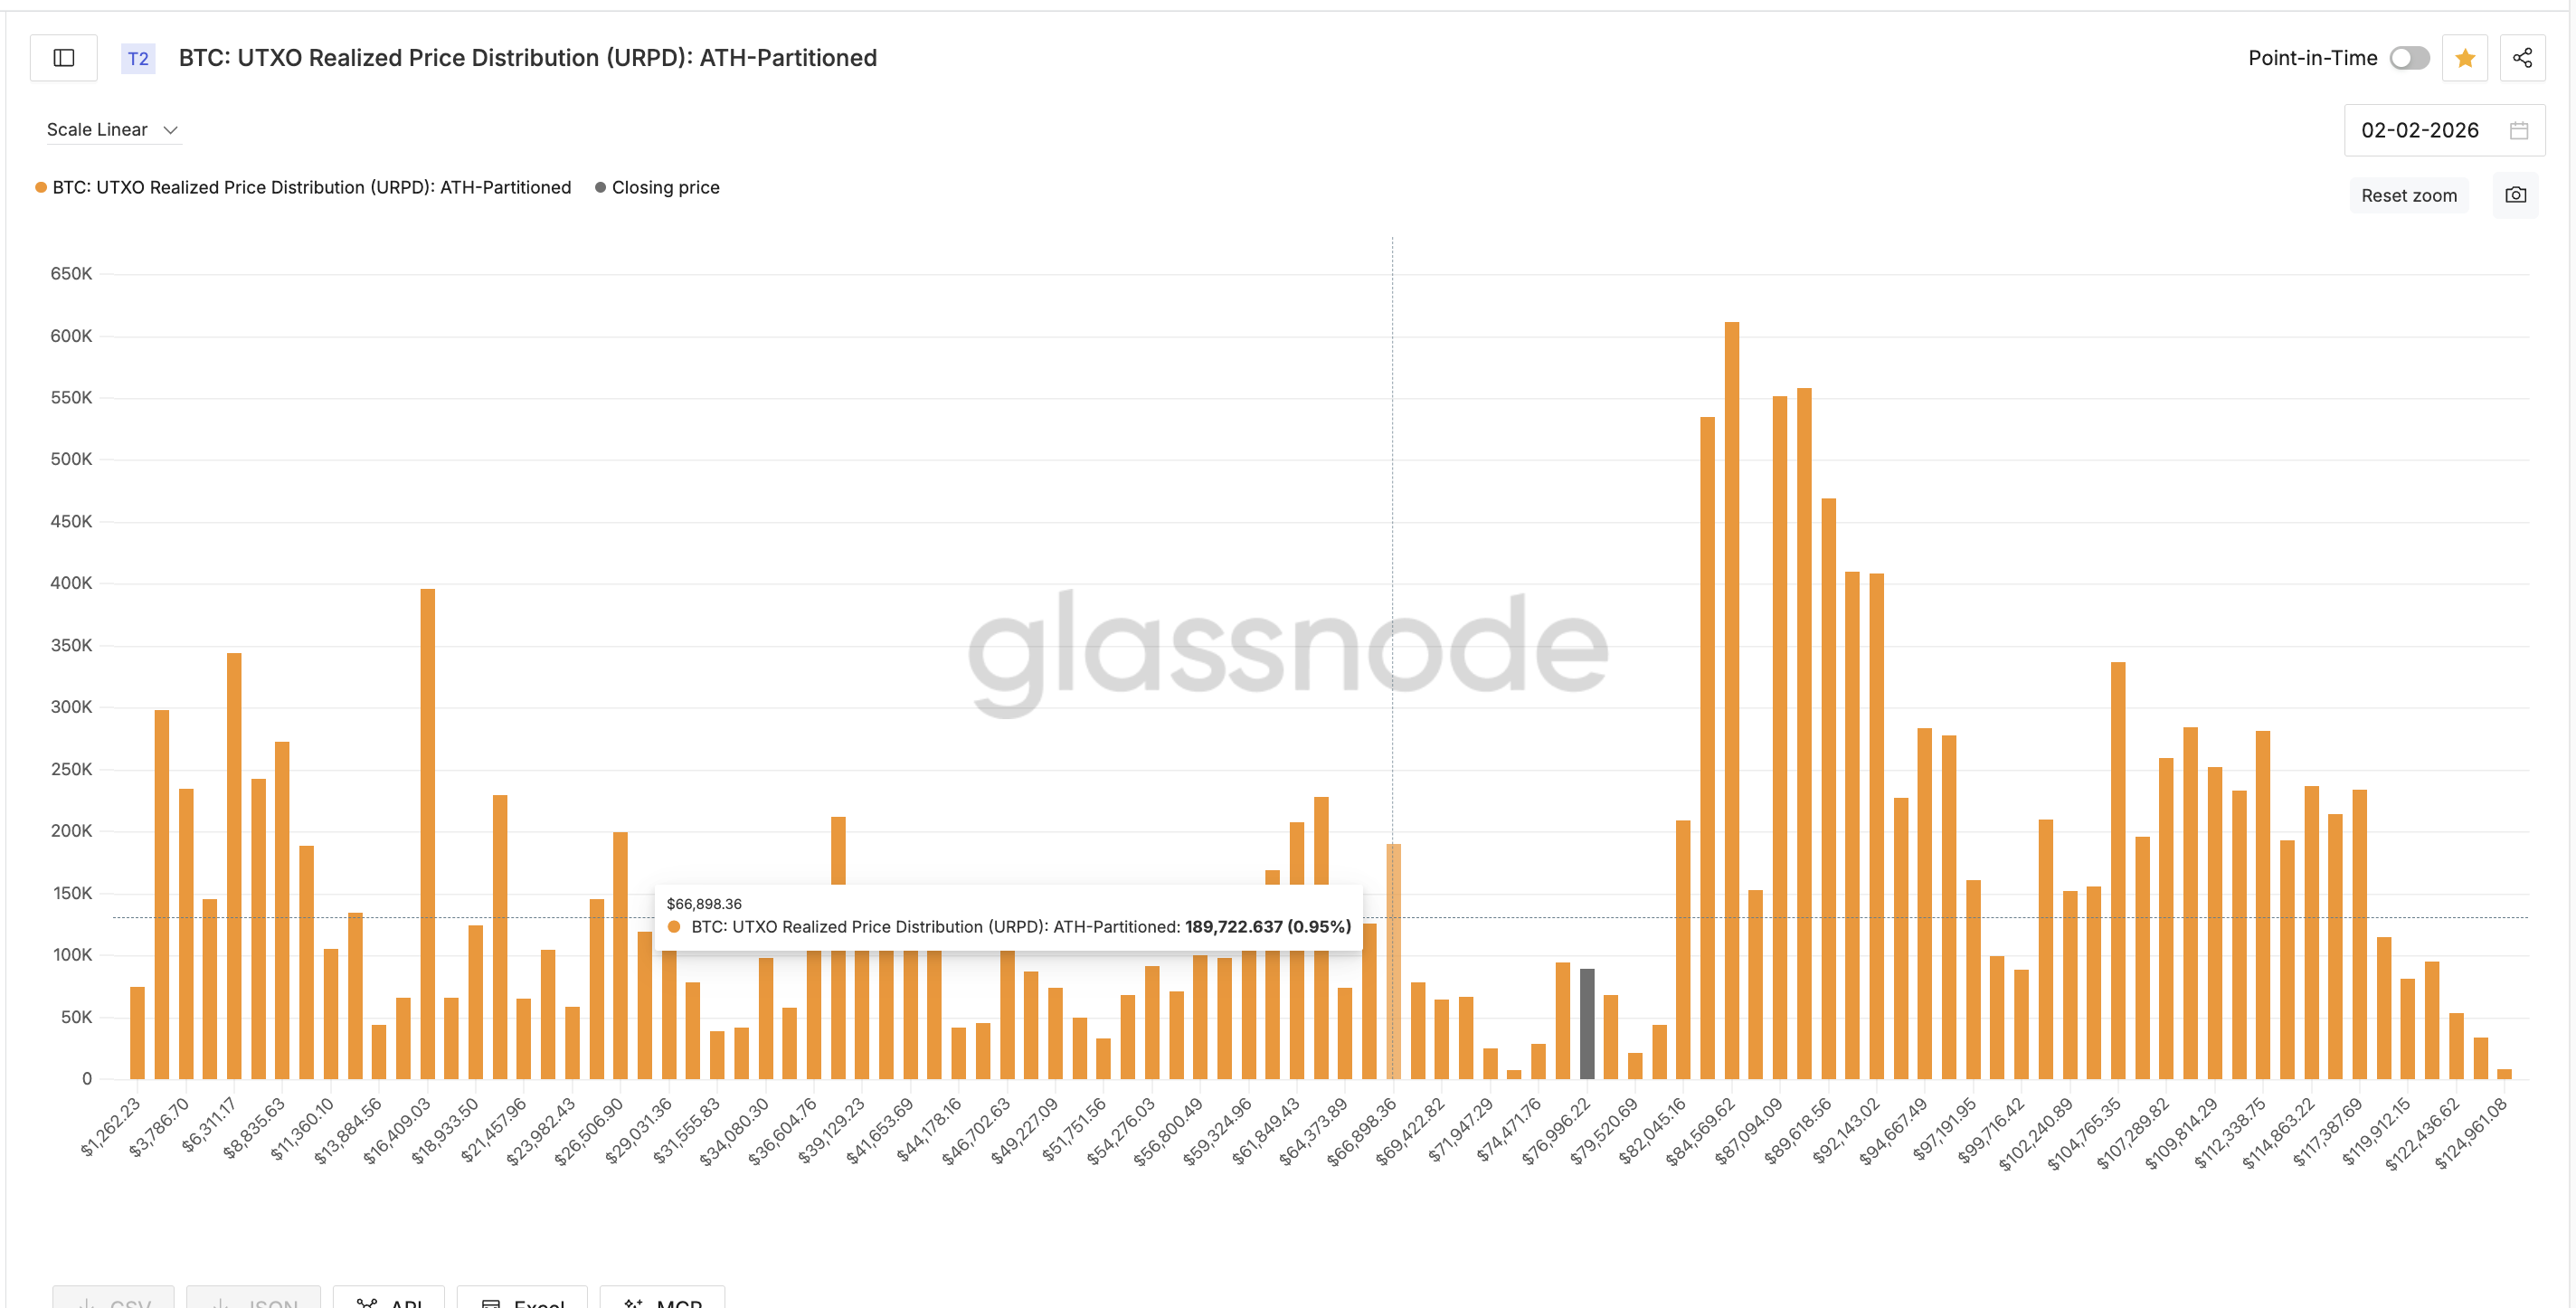
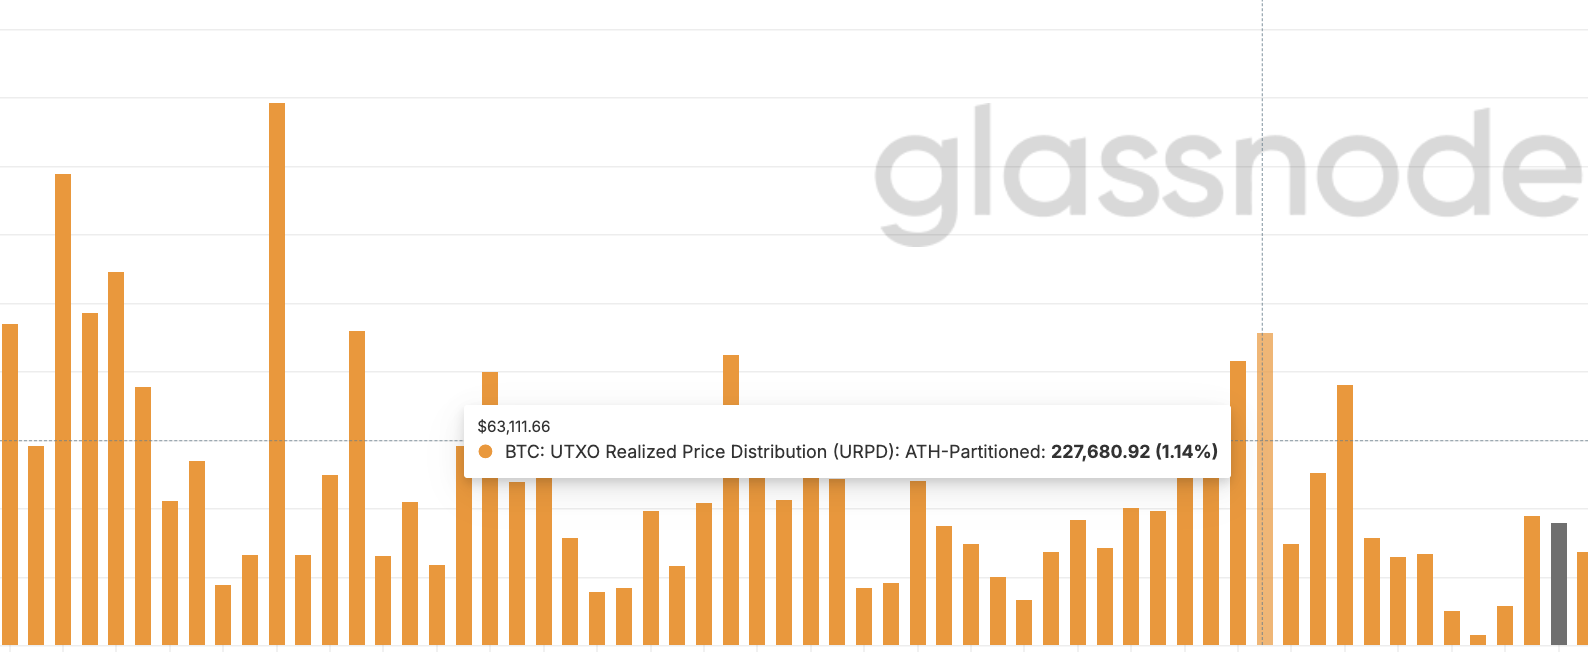
Below that, another major cluster appears near $63,111, holding roughly 1.14% of supply. These zones could attract buyers if the price continues falling. That’s the strongest near-term on-chain support for BTC.
From a technical perspective, a breakdown below $75,630-$75,130 opens the path toward $69,500. Losing that level would expose Bitcoin to the $66,000–$63,000 range, the key cluster zones. In a deeper sell-off, support near $61,840 becomes relevant. Therefore, $69,500 becomes the key decision zone if $BTC loses $75,130.
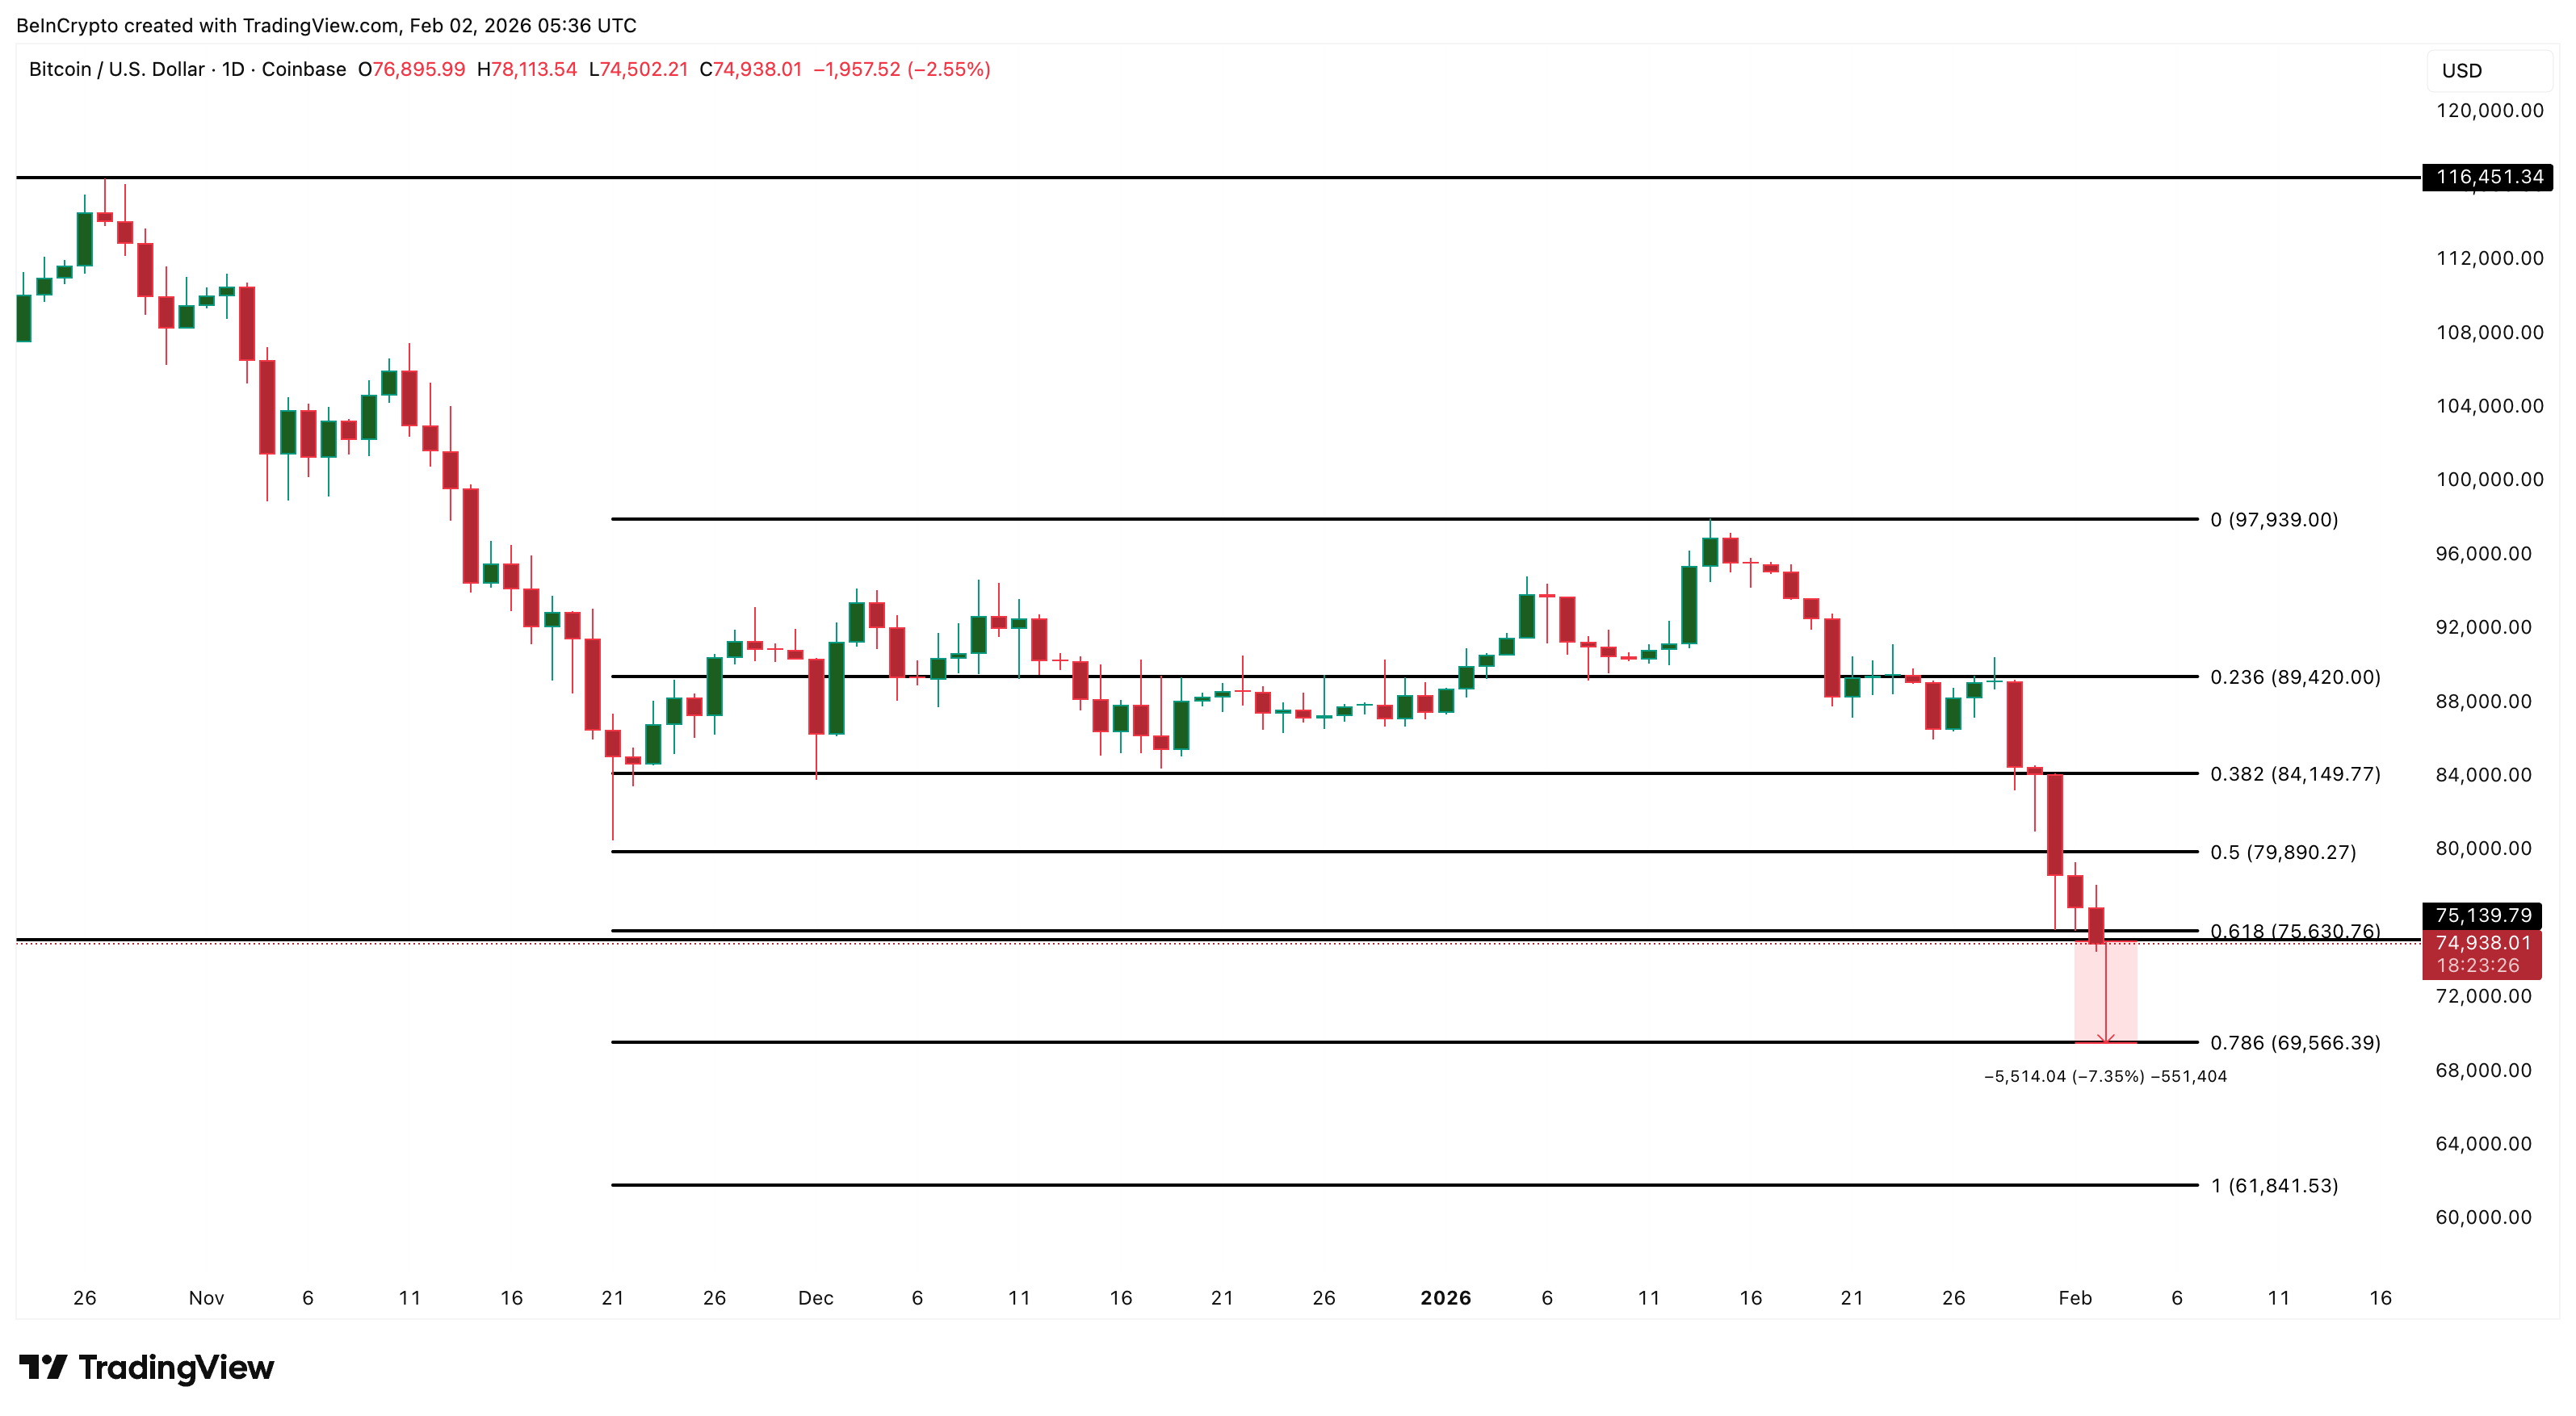
On the upside, recovery attempts face resistance near $79,890 and $84,140. A sustained move above $84,140 would be needed to restore a bullish structure. Until then, downside risks remain dominant.
* The content presented above, whether from a third party or not, is considered as general advice only. This article should not be construed as containing investment advice, investment recommendations, an offer of or solicitation for any transactions in financial instruments.


