Cardano Price Forecast: ADA builds bearish momentum amid on-chain weakness

แหล่งที่มา Fxstreet
  • Cardano price hovers $0.650 on Tuesday after falling nearly 6% over the last two days.
  • On-chain data show a bearish picture as funding rates are negative and network activity is falling.
  • The technical outlook suggests a correction as momentum indicators show bearish signs.

Cardano (ADA) price hovers around $0.650 at the time of writing on Tuesday after falling nearly 6% over the last two days. On-chain data supports the bearish thesis, as funding rates are negative and network activity is falling. The technical outlook suggests a correction, as the momentum indicators, the Relative Strength Index (RSI) and Moving Average Convergence Divergence (MACD) show bearish signs.

Cardano’s network activity and funding rates show a bearish bias

Coinglass's OI-Weighted Funding Rate data shows that the number of traders betting that the price of Cardano will slide further is higher than that anticipating a price increase. 

This index is based on the yields of futures contracts, which are weighted by their Open Interest (OI) rates. Generally, a positive rate (longs pay shorts) indicates bullish sentiment, while negative numbers (shorts pay longs) indicate bearishness.

In the case of ADA, the metric stands at -0.0017%, reflecting a negative rate and indicating that shorts are paying longs. This scenario often signifies bearish sentiment in the market, suggesting potential downward pressure on ADA price.

Cardano Funding rate chart. Source: Coinglass

Cardano Funding rate chart. Source: Coinglass

Besides negative funding rates, Coinglass’s Daily Active Addresses index, which tracks network activity over time, also paints a bearish picture for ADA. A rise in the metric signals greater blockchain usage, while declining addresses point to lower demand for the network.

In ADA’s case, Daily Active Addresses have been extending a downtrend starting in early March and reading 21,600 on Tuesday. This indicates that demand for ADA’s blockchain usage is decreasing, which doesn’t bode well for Cardano's price.

Cardano daily active addresses chart. Source: Santiment

Cardano daily active addresses chart. Source: Santiment

Cardano Price Forecast: Momentum indicators reflect bearish signals 

Cardano price failed to close above the weekly resistance of $0.746 on April 24, leading to a correction of 8.3% over the last 12 days. At the time of writing on Tuesday, it hovers around $0.660.

If ADA continues to correct, it could extend the decline to retest its April 22 low of $0.615.

The RSI on the daily chart reads 46, below its neutral level of 50, indicating bearish momentum. The MACD indicators also show a bearish crossover on Monday, giving sell signals and suggesting a bearish trend.
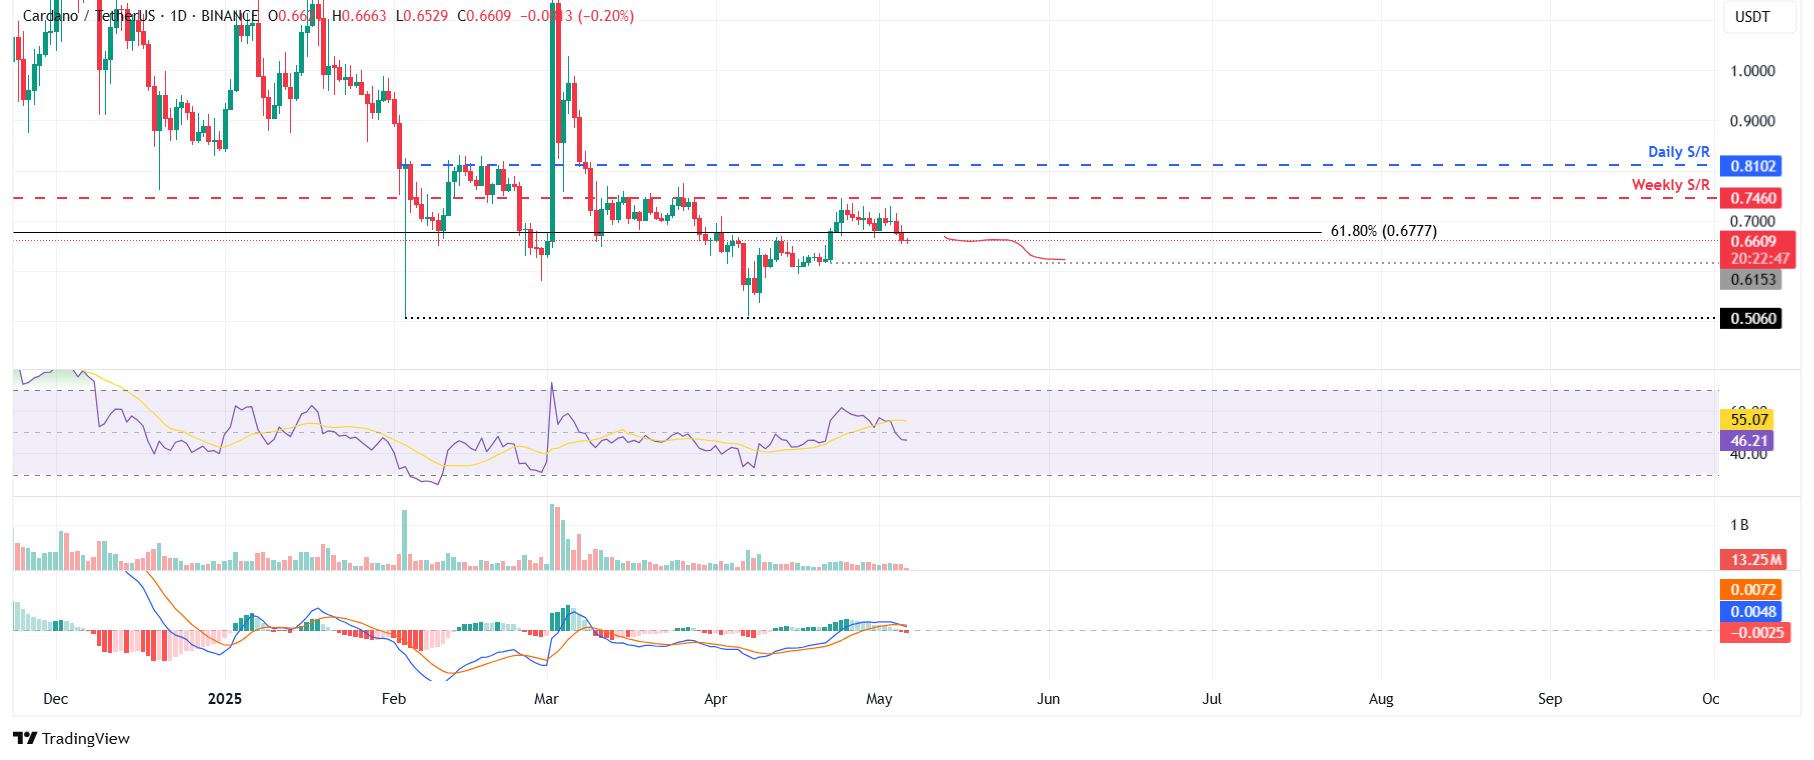
ADA/USDT daily chart

ADA/USDT daily chart

However, if ADA closes above the weekly level of $0.746, it could extend the rally to retest its next daily support at $0.810.

ข้อจำกัดความรับผิดชอบ: เพื่อการอ้างอิงเท่านั้น ผลการดำเนินงานในอดีตไม่ได้บ่งบอกถึงผลลัพธ์ในอนาคต
placeholder
การคาดการณ์ราคาหุ้น AAPL: ภายในปี 2566 นี้ จะสามารถกลับคืนสู่มูลค่าตลาด 3 ล้านล้าน ได้หรือไม่?การลดลงของราคาหุ้นของ Apple มีสาเหตุหลักมาจากปัจจัยด้านลบและทัศนคติเชิงลบของนักลงทุนที่มีต่อตลาดโดยรวม คุณค่าที่แท้จริง รวมถึงประสิทธิภาพของผลิตภัณฑ์ และ บริการ Apple จะยังคงเป็นปัจจัยเชิงบวกได้ตลอดทั้งปี 2022 ปัจจัยลบระดับมหภาคที่ส่งผลต่อราคาหุ้น Apple จะค่อยๆ อ่อนตัวลงในปี 2566
ผู้เขียน  Mitrade
วันที่ 08 มิ.ย. 2023
การลดลงของราคาหุ้นของ Apple มีสาเหตุหลักมาจากปัจจัยด้านลบและทัศนคติเชิงลบของนักลงทุนที่มีต่อตลาดโดยรวม คุณค่าที่แท้จริง รวมถึงประสิทธิภาพของผลิตภัณฑ์ และ บริการ Apple จะยังคงเป็นปัจจัยเชิงบวกได้ตลอดทั้งปี 2022 ปัจจัยลบระดับมหภาคที่ส่งผลต่อราคาหุ้น Apple จะค่อยๆ อ่อนตัวลงในปี 2566
placeholder
Nikkei มีแนวโน้มจะเกิดการ double dip หรือไม่ ?ตลาดหุ้นญี่ปุ่นเผชิญกับการขายทิ้งในวันที่ 4 กันยายน ซึ่งถือเป็นปฏิกิริยาต่อเนื่องของตลาดจากการลดลงในช่วงต้นเดือนสิงหาคมและการฟื้นตัวหลังจากนั้นตามที่นักกลยุทธ์ของ Citi กล่าว การขายออกน่าจะเกิดจากการปร
ผู้เขียน  Investing.com
วันที่ 05 ก.ย. 2024
ตลาดหุ้นญี่ปุ่นเผชิญกับการขายทิ้งในวันที่ 4 กันยายน ซึ่งถือเป็นปฏิกิริยาต่อเนื่องของตลาดจากการลดลงในช่วงต้นเดือนสิงหาคมและการฟื้นตัวหลังจากนั้นตามที่นักกลยุทธ์ของ Citi กล่าว การขายออกน่าจะเกิดจากการปร
placeholder
คาดการณ์ XAUUSD: ราคาทองคำถอยห่างจากจุดสูงสุดตลอดกาลที่ $3,245ราคาทองคำกลับมาลดลงในช่วงเช้าวันจันทร์ หยุดการปรับตัวขึ้นเป็นประวัติการณ์สามวันที่แตะระดับสูงสุดตลอดกาลที่ $3,245 ซึ่งตั้งไว้เมื่อวันศุกร์
ผู้เขียน  FXStreet
4 เดือน 14 วัน จันทร์
ราคาทองคำกลับมาลดลงในช่วงเช้าวันจันทร์ หยุดการปรับตัวขึ้นเป็นประวัติการณ์สามวันที่แตะระดับสูงสุดตลอดกาลที่ $3,245 ซึ่งตั้งไว้เมื่อวันศุกร์
placeholder
คาดการณ์ XAUUSD: ราคาทองคำพุ่งใกล้ $3,350 จากความไม่แน่นอนเกี่ยวกับนโยบายภาษีของทรัมป์ราคาทองคํา (XAU/USD) ปรับตัวสูงขึ้นใกล้ $3,350 ในช่วงเช้าของตลาดลงทุนเอเชียวันจันทร์ หลังจากเผชิญกับการปิดออเดอร์เพื่อทำกำไรจากวันหยุดยาว ความไม่แน่นอนเกี่ยวกับนโยบายภาษีของประธานาธิบดีสหรัฐฯ โดนัลด์ ทรัมป์ และความตึงเครียดทางภูมิศาสตร์ที่ยังคงมีอยู่ ยังคงสนับสนุนราคาทองคำ
ผู้เขียน  FXStreet
4 เดือน 21 วัน จันทร์
ราคาทองคํา (XAU/USD) ปรับตัวสูงขึ้นใกล้ $3,350 ในช่วงเช้าของตลาดลงทุนเอเชียวันจันทร์ หลังจากเผชิญกับการปิดออเดอร์เพื่อทำกำไรจากวันหยุดยาว ความไม่แน่นอนเกี่ยวกับนโยบายภาษีของประธานาธิบดีสหรัฐฯ โดนัลด์ ทรัมป์ และความตึงเครียดทางภูมิศาสตร์ที่ยังคงมีอยู่ ยังคงสนับสนุนราคาทองคำ
placeholder
การเคลื่อนไหวของราคา GBPJPY: ปอนด์ยังคงแข็งค่าที่ใกล้ 191.00 ท่ามกลางสภาพแวดล้อมทางเทคนิคที่หลากหลายคู่ GBP/JPY แสดงการเคลื่อนไหวเล็กน้อยในวันจันทร์ โดยทรงตัวใกล้โซน 191.00 หลังจากช่วงตลาดยุโรป การเคลื่อนไหวของราคาอยู่ในระดับแบนในช่วงแคบ สะท้อนถึงความไม่แน่นอนในทิศทาง ขณะที่ตัวชี้วัดโมเมนตัมส่งสัญญาณที่ขัดแย้งกัน
ผู้เขียน  FXStreet
6 ชั่วโมงที่แล้ว
คู่ GBP/JPY แสดงการเคลื่อนไหวเล็กน้อยในวันจันทร์ โดยทรงตัวใกล้โซน 191.00 หลังจากช่วงตลาดยุโรป การเคลื่อนไหวของราคาอยู่ในระดับแบนในช่วงแคบ สะท้อนถึงความไม่แน่นอนในทิศทาง ขณะที่ตัวชี้วัดโมเมนตัมส่งสัญญาณที่ขัดแย้งกัน
ตราสารที่เกี่ยวข้อง
goTop
quote