US Dollar Index Price Forecast: Moves below 104.50 toward nine-day EMA support

Fonte Fxstreet
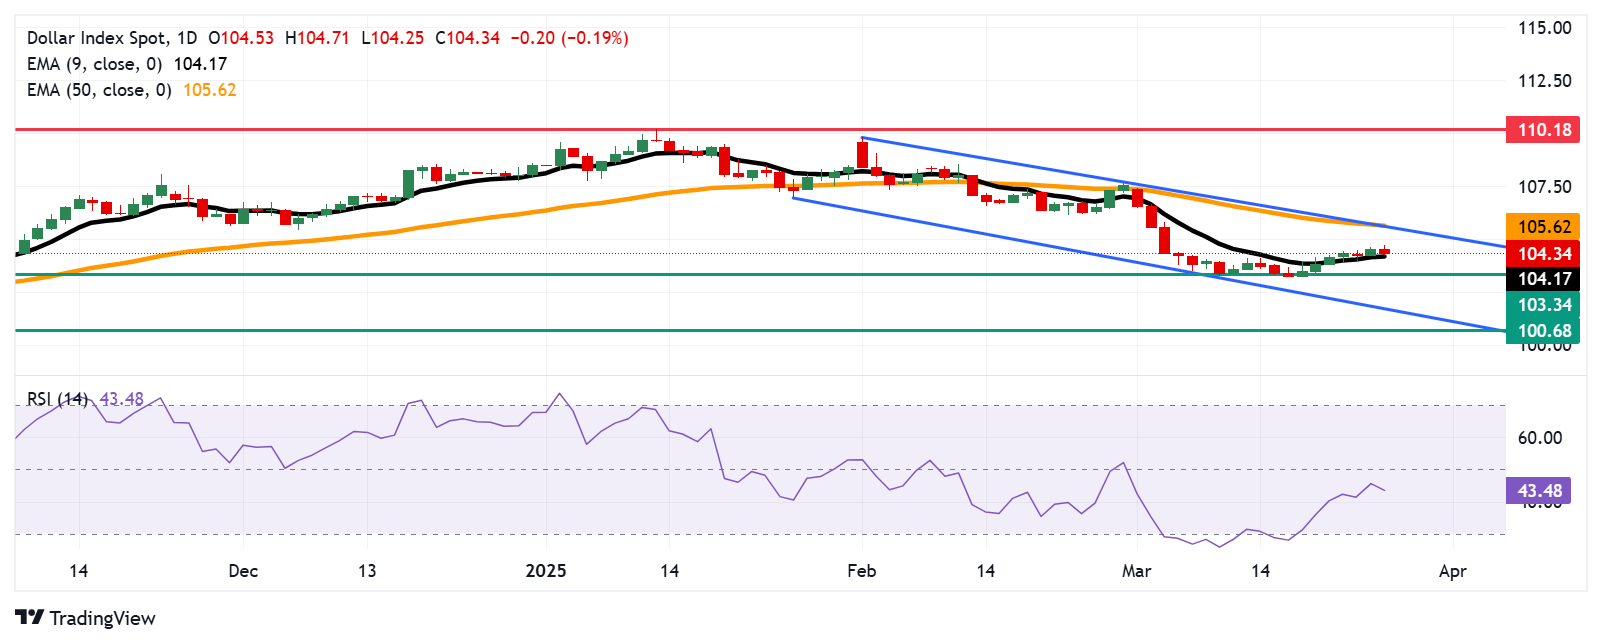
  • The US Dollar Index may test immediate support at the nine-day EMA of 104.17.
  • The 14-day RSI remains below 50, reinforcing the bearish bias.
  • Initial resistance is seen at the 50-day EMA at 105.62.

The US Dollar Index (DXY), which measures the US Dollar (USD) against six major currencies, has given up its recent gains from the previous session, hovering near 104.30 during Thursday's Asian trading hours. The technical analysis of the daily chart indicates a persistent bearish bias, with the index trending lower within a descending channel.

Additionally, the 14-day Relative Strength Index (RSI) remains below 50, reinforcing the bearish outlook. However, the US Dollar Index is holding above the nine-day Exponential Moving Average (EMA), suggesting an improvement in short-term price momentum.

On the downside, the US Dollar Index could test immediate support at the nine-day EMA of 104.17, followed by the four-month low of 103.34, recorded on November 6. A decisive break below this crucial support zone may weaken the short-term price momentum, potentially driving the index toward the five-month low of 100.68.

The DXY may explore the region around the 50-day EMA at 105.62, aligned with the descending channel's upper boundary. A break above this level could reinforce the bullish bias and support the index to approach 110.18, the highest level since November 2022.

US Dollar Index: Daily Chart
US Dollar PRICE Today

The table below shows the percentage change of US Dollar (USD) against listed major currencies today. US Dollar was the weakest against the British Pound.

  USD EUR GBP JPY CAD AUD NZD CHF
USD   -0.23% -0.25% -0.23% 0.00% -0.18% -0.22% -0.07%
EUR 0.23%   -0.04% 0.00% 0.22% 0.01% -0.00% 0.15%
GBP 0.25% 0.04%   0.04% 0.26% 0.06% 0.02% 0.16%
JPY 0.23% 0.00% -0.04%   0.23% 0.01% -0.02% 0.13%
CAD -0.01% -0.22% -0.26% -0.23%   -0.18% -0.22% -0.09%
AUD 0.18% -0.01% -0.06% -0.01% 0.18%   -0.02% 0.11%
NZD 0.22% 0.00% -0.02% 0.02% 0.22% 0.02%   0.13%
CHF 0.07% -0.15% -0.16% -0.13% 0.09% -0.11% -0.13%  

The heat map shows percentage changes of major currencies against each other. The base currency is picked from the left column, while the quote currency is picked from the top row. For example, if you pick the US Dollar from the left column and move along the horizontal line to the Japanese Yen, the percentage change displayed in the box will represent USD (base)/JPY (quote).


Isenção de responsabilidade: Apenas para fins informativos. O desempenho passado não é indicativo de resultados futuros.
placeholder
XPSF11 recicla carteira e eleva caixa; VGIP11 tem queda no lucro e paga menor dividendo em 6 mesesO fundo de investimento imobiliário XP Selection (XPSF11) divulgou seu relatório gerencial referente ao mês de setembro, informando um lucro de R$ 2,858 milhões.
Autor  Pedro Augusto Prazeres
10 Mês 31 Dia Sex
O fundo de investimento imobiliário XP Selection (XPSF11) divulgou seu relatório gerencial referente ao mês de setembro, informando um lucro de R$ 2,858 milhões.
placeholder
HGLG11 projeta alta na vacância para 2026; RZAK11 paga yield de 1,35% e RZAT11 reduz dividendoO fundo imobiliário CSHG Logística (HGLG11) divulgou seu relatório gerencial referente ao mês de outubro, informando um resultado distribuível de R$ 32,246 milhões. O montante representa um recuo em relação ao desempenho de setembro, quando o fundo havia registrado R$ 36,939 milhões.
Autor  Pedro Augusto Prazeres
11 Mês 20 Dia Qui
O fundo imobiliário CSHG Logística (HGLG11) divulgou seu relatório gerencial referente ao mês de outubro, informando um resultado distribuível de R$ 32,246 milhões. O montante representa um recuo em relação ao desempenho de setembro, quando o fundo havia registrado R$ 36,939 milhões.
placeholder
O JPMorgan alertou que a decisão da MSCI, prevista para 15 de janeiro de 2026, poderá excluir a estratégia de Michael Saylor dos principais índices de ações.O JPMorgan alertou que a decisão da MSCI, prevista para 15 de janeiro de 2026, poderá excluir a estratégia de Michael Saylor dos principais índices de ações.
Autor  Cryptopolitan
Ontem 01: 40
O JPMorgan alertou que a decisão da MSCI, prevista para 15 de janeiro de 2026, poderá excluir a estratégia de Michael Saylor dos principais índices de ações.
placeholder
XRP perde US$ 2,00 com venda de baleias; Bitcoin tem "preço de liquidação" entre US$ 73 mil e US$ 84 milO preço do XRP caiu abaixo do nível psicológico crucial de US$ 2,00 nesta quinta-feira (20), revisitando patamares de preço que haviam sido vistos pela última vez durante a queda brusca de 10 de outubro. A desvalorização ocorre em meio a um sentimento pessimista generalizado no mercado de criptomoedas, que foi arrastado pela fraqueza do Bitcoin.
Autor  Pedro Augusto Prazeres
Ontem 01: 55
O preço do XRP caiu abaixo do nível psicológico crucial de US$ 2,00 nesta quinta-feira (20), revisitando patamares de preço que haviam sido vistos pela última vez durante a queda brusca de 10 de outubro. A desvalorização ocorre em meio a um sentimento pessimista generalizado no mercado de criptomoedas, que foi arrastado pela fraqueza do Bitcoin.
placeholder
RBRL11 avança na venda de portfólio; AAZQ11 paga yield de 18% ao ano e investe em cooperativaO fundo imobiliário RBR Log (RBRL11) divulgou seu relatório gerencial referente ao mês de outubro de 2025, informando um lucro líquido de R$ 4,831 milhões. O resultado representa uma queda significativa em comparação ao desempenho do mês anterior.
Autor  Pedro Augusto Prazeres
Ontem 02: 03
O fundo imobiliário RBR Log (RBRL11) divulgou seu relatório gerencial referente ao mês de outubro de 2025, informando um lucro líquido de R$ 4,831 milhões. O resultado representa uma queda significativa em comparação ao desempenho do mês anterior.
Produtos relacionados
goTop
quote