


Dow Jones Industrial Average extends losses, sheds another 100 points
- The Dow Jones falls another 0.25% during quiet Friday trading.
- Equity indexes are broadly lower as investors weigh their options.
- Markets already look ahead to next week’s Fed rate call on December 18.
The Dow Jones Industrial Average (DJIA) softened during a sedate Friday session. The economic calendar was strictly a low-tier affair during the US market session, leaving investors to stew on the future pace of rate cuts from the Federal Reserve (Fed). The DJIA extended a thin but persistent near-term decline, dipping further below the 44,000 handle and posting a seventh straight downside trading day.
US Export and Import Price Index figures released on Friday broadly beat expectations, but the low impact data prints barely registered on the needle as investors look ahead to next week’s high impact economic data docket. A fresh round of US Purchasing Managers Index (PMI) survey figures will kick off next week, with S&P Global Manufacturing and Services PMI figures due on Monday. US Retail Sales figures for November will follow up on Tuesday and are expected to rise to 0.5% from 0.4% MoM.
US inflation metrics accelerated in November, according to key data releases this week. However, the uptick in costs wasn’t enough to push investors off their current bets of a quarter-point cut from the Fed’s rate call due next week on Wednesday, December 18. According to the CME’s FedWatch Tool, rate traders have piled into confident bets that the Fed will cut one last time in 2024 with 97% odds priced in of a 25 bps rate trim next week.
Dow Jones news
Most of the Dow Jones is trading on the sedate side, but losses in key equities are dragging the overall board lower with Nvidia (NVDA) shedding around 2.5% and declining to $134 per share as the broad market tech rally takes a breather. On the high side, UnitedHealth Group (UNH) has recovered 1.2% on Friday, climbing back above $522 per share after several days of headline-driven losses.
Dow Jones price forecast
Friday’s 100-plus point decline in the Dow Jones index puts the major equity board down almost 3% from recent record highs above 45,000. Despite seven straight trading days on the low side, the Dow Jones is still holding comfortably in bull country with price action north of the 50-day Exponential Moving Average (EMA) near 43,490.
A near-term bearish drag on index prices may be running out of runway in short order. The Dow Jones has put in a stellar track record over the past 12 months of outrunning its own moving averages. Bidders will likely be looking to re-enter the fray once bids make contact with the 50-day EMA. However, a snap below the last swing low into the 43,000 handle could see a fresh round of bearish momentum.
Dow Jones daily chart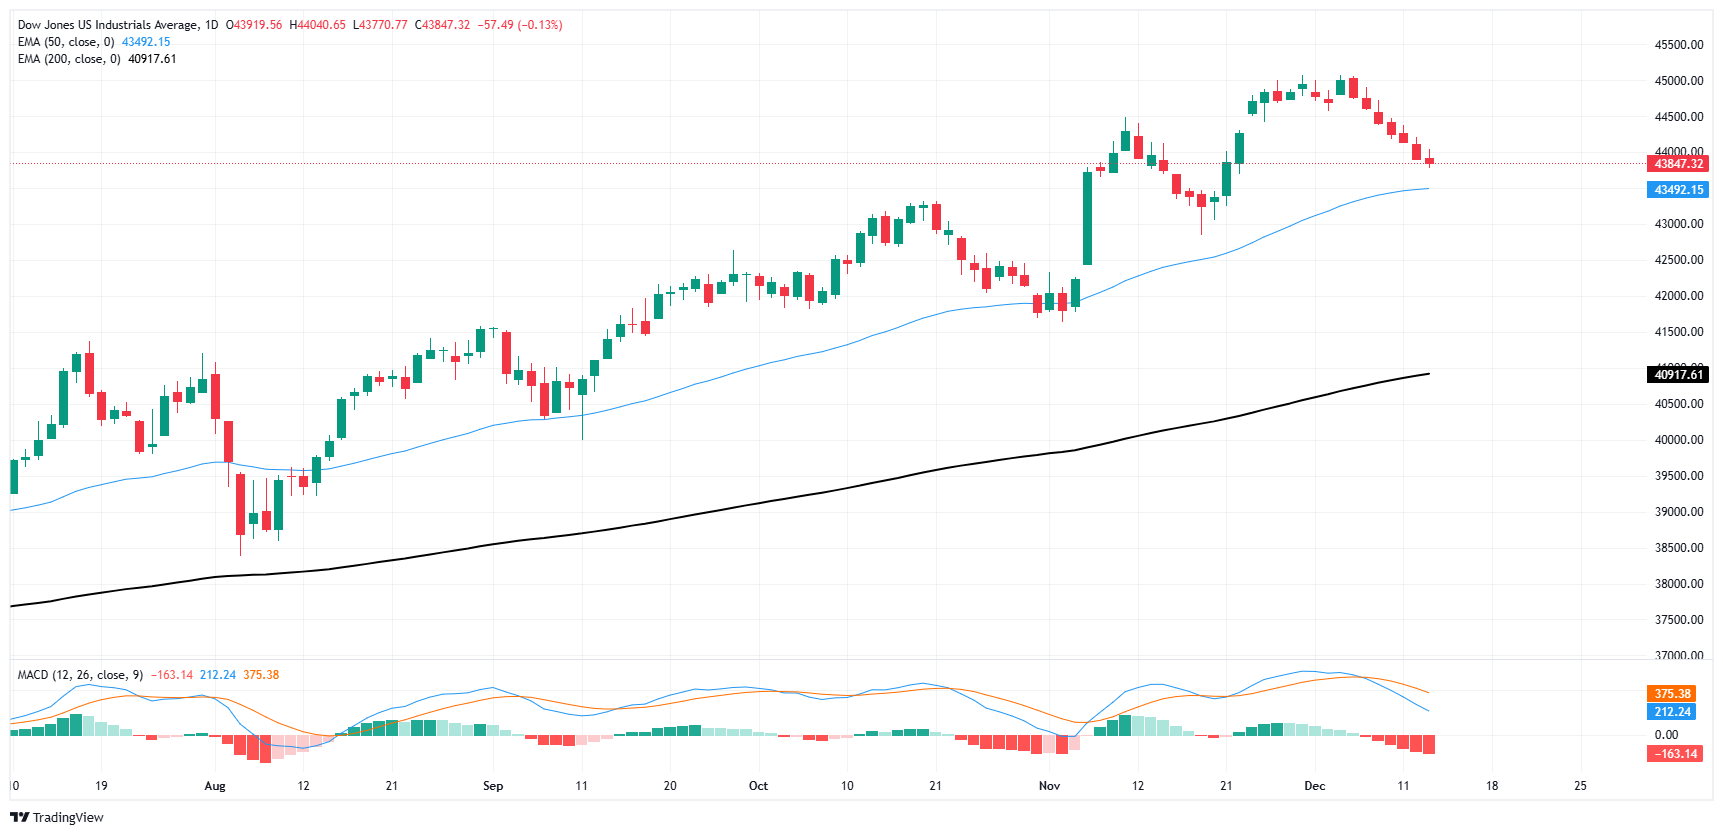
Dow Jones FAQs
The Dow Jones Industrial Average, one of the oldest stock market indices in the world, is compiled of the 30 most traded stocks in the US. The index is price-weighted rather than weighted by capitalization. It is calculated by summing the prices of the constituent stocks and dividing them by a factor, currently 0.152. The index was founded by Charles Dow, who also founded the Wall Street Journal. In later years it has been criticized for not being broadly representative enough because it only tracks 30 conglomerates, unlike broader indices such as the S&P 500.
Many different factors drive the Dow Jones Industrial Average (DJIA). The aggregate performance of the component companies revealed in quarterly company earnings reports is the main one. US and global macroeconomic data also contributes as it impacts on investor sentiment. The level of interest rates, set by the Federal Reserve (Fed), also influences the DJIA as it affects the cost of credit, on which many corporations are heavily reliant. Therefore, inflation can be a major driver as well as other metrics which impact the Fed decisions.
Dow Theory is a method for identifying the primary trend of the stock market developed by Charles Dow. A key step is to compare the direction of the Dow Jones Industrial Average (DJIA) and the Dow Jones Transportation Average (DJTA) and only follow trends where both are moving in the same direction. Volume is a confirmatory criteria. The theory uses elements of peak and trough analysis. Dow’s theory posits three trend phases: accumulation, when smart money starts buying or selling; public participation, when the wider public joins in; and distribution, when the smart money exits.
There are a number of ways to trade the DJIA. One is to use ETFs which allow investors to trade the DJIA as a single security, rather than having to buy shares in all 30 constituent companies. A leading example is the SPDR Dow Jones Industrial Average ETF (DIA). DJIA futures contracts enable traders to speculate on the future value of the index and Options provide the right, but not the obligation, to buy or sell the index at a predetermined price in the future. Mutual funds enable investors to buy a share of a diversified portfolio of DJIA stocks thus providing exposure to the overall index.
Artigos Recomendados


