


US Dollar strengthens as dust settles over political turmoil in US
- The US Dollar jumps higher ahead of US Retail Sales data.
- Traders are pricing in a Trump victory with the Fed keeping a lit on projections.
- The US Dollar index moves higher and trades near a pivotal level for more upside.
The US Dollar (USD) edges higher on Tuesday due to several events that took place overnight. First and foremost for financial markets was the interview with US Federal Reserve (Fed) Chairman Jerome Powell, which disappointed traders hoping to hear anything on guidance, but his lips remained sealed. In Milwaukee, former US President Donald Trump took the stage after his shooting over the weekend, announcing that Ohio senator J.D. Vance will be his running mate.
On the economic front, it will all revolve around the consumer, with US Retail Sales and Import/Export Prices for June being published later in the day. A rewind to the previous Retail Sales number revealed that consumers had had enough of the current elevated price levels and were willing to wait for their next purchase until prices would come down. If that is the case again for June numbers, that would mean a substantial decline in Retail Sales, resulting in a weaker US Dollar.
Daily digest market movers: Data to the forefront
- With former US President Trump picking J.D. Vance as running mate, the main theme for Trump’s campaign becomes very clear, as Senator Vance is known for his call for more harsh and severe measures against China. This means a bigger and broader tariff package against China and other countries that import goods to the US.
- At 12:30 GMT, the monthly Retail Sales data for June will be released, together with the Import-Export Price Index:
- Retail Sales are expected to remain unchanged at 0% in the month after growing by 0.1% in May.
- Retail Sales ex Autos are seen growing 0.1% after the -0.1% in May.
- As usual, revisions of the previous numbers will be more important and market-moving than the actual data.
- The monthly Import Price Index is expected to increase by 0.2% in June from -0.4% the previous month.
- The monthly Export Price Index was at -0.6% in May, with no projection forecasted.
- At 14:00 GMT, the Business Inventories data for May will be released, and they are expected to remain stable at 0.3%.
- At the same time, the NAHB Housing Market Index for July will be released by the National Association of Home Builders. Previously, the Index stood at 43, with a small uptick to 44 expected.
- Equity markets are very mixed with no clear pattern, besides that, European equities are on the back foot. US futures are marginally in the green.
- The CME Fedwatch Tool shows an 89.4% chance of a 25 basic points (bps) interest rate cut by the Fed in September and 10.4% for a 50 bps cut. An unchanged scenario with no rate change is off the table.
- The US 10-year benchmark rate trades at 4.20%, flirting with the yearly lows.
US Dollar Index Technical Analysis: Running mate priced in
The US Dollar Index (DXY) is recovering, with traders pricing in some severe trade wars coming up should former President Trump win the elections in November. By picking J.D. Vance as his running mate, Trump has chosen a US Senator who outspokenly disfavors China and wants to limit foreign countries’ influences and imports on the US economy. Trade wars and tariffs are often seen as supportive of the US Dollar, which was the case at the start of 2018 when Trump started by slapping tariffs on Chinese imports and made the DXY rally 16% over two years with the tariffs in place.
On Tuesday, the DXY is still below all three major Simple Moving Averages (SMA) after its meltdown last week. The first barrier to recovery is the 200-day SMA at 104.37. Next, the 100-day SMA resides near 104.81, while the declining 55-day SMA is trading at 105.03.
On the downside, the weak spot has been identified now at 103.99/104.00. Expect to see pressure mounting on that level with each test. Certainly, when the DXY bounces off that level each time, the bounces' highs would become smaller until the support gives way. A technical element to look out for could be that the 55-day SMA starts to break below the 100-day SMA and/or the 200-day SMA, risking a ‘death cross’ in technical terms, which is a catalyst for a substantially longer-term sell-off.
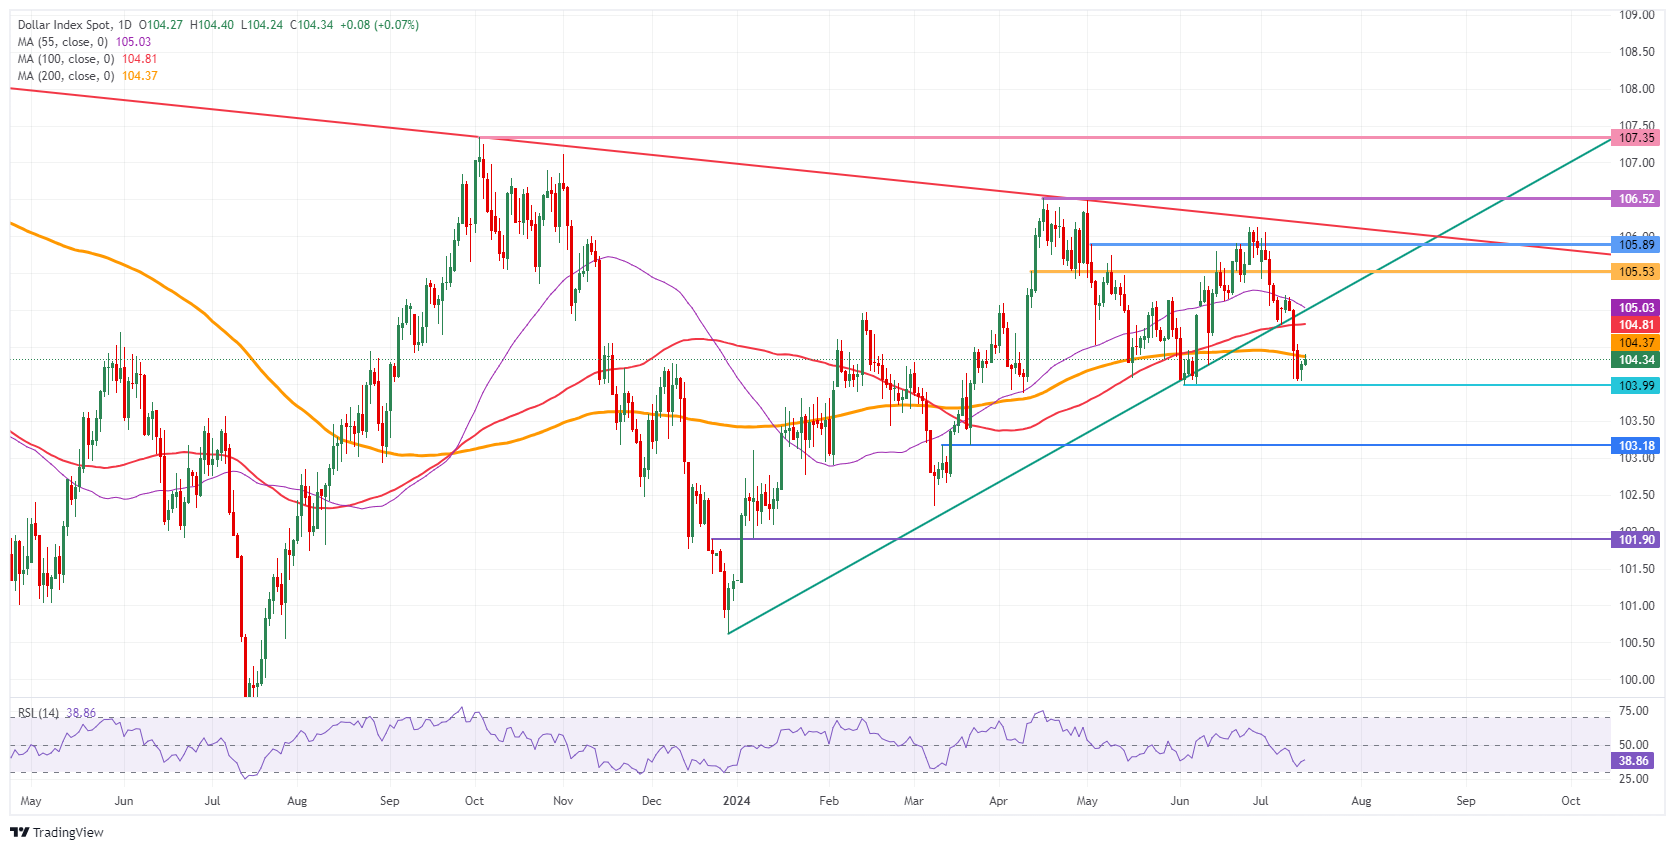
US Dollar Index: Daily Chart
US Dollar FAQs
The US Dollar (USD) is the official currency of the United States of America, and the ‘de facto’ currency of a significant number of other countries where it is found in circulation alongside local notes. It is the most heavily traded currency in the world, accounting for over 88% of all global foreign exchange turnover, or an average of $6.6 trillion in transactions per day, according to data from 2022. Following the second world war, the USD took over from the British Pound as the world’s reserve currency. For most of its history, the US Dollar was backed by Gold, until the Bretton Woods Agreement in 1971 when the Gold Standard went away.
The most important single factor impacting on the value of the US Dollar is monetary policy, which is shaped by the Federal Reserve (Fed). The Fed has two mandates: to achieve price stability (control inflation) and foster full employment. Its primary tool to achieve these two goals is by adjusting interest rates. When prices are rising too quickly and inflation is above the Fed’s 2% target, the Fed will raise rates, which helps the USD value. When inflation falls below 2% or the Unemployment Rate is too high, the Fed may lower interest rates, which weighs on the Greenback.
In extreme situations, the Federal Reserve can also print more Dollars and enact quantitative easing (QE). QE is the process by which the Fed substantially increases the flow of credit in a stuck financial system. It is a non-standard policy measure used when credit has dried up because banks will not lend to each other (out of the fear of counterparty default). It is a last resort when simply lowering interest rates is unlikely to achieve the necessary result. It was the Fed’s weapon of choice to combat the credit crunch that occurred during the Great Financial Crisis in 2008. It involves the Fed printing more Dollars and using them to buy US government bonds predominantly from financial institutions. QE usually leads to a weaker US Dollar.
Quantitative tightening (QT) is the reverse process whereby the Federal Reserve stops buying bonds from financial institutions and does not reinvest the principal from the bonds it holds maturing in new purchases. It is usually positive for the US Dollar.
Artigos Recomendados


