
Top Crypto Gainers: ENS, CRV, SEI – Bulls eye further gains amid breakout runs, golden crossovers
- Ethereum Naming Service edges higher by nearly 9% so far on Wednesday, targeting $28.
- Curve DAO prints its fourth consecutive bullish day, alongside a golden cross, aiming to surpass the $0.80 mark.
- SEI surpasses the $0.36 barrier, signaling a potential golden cross and targeting $0.48.
The broader cryptocurrency market maintains bullish momentum, with altcoins such as Ethereum Name Service (ENS), Curve DAO (CRV), and Sei (SEI) extending gains amid Bitcoin (BTC) slipping below $118,000. The technical outlook suggests a bullish bias as the uptrend gains momentum and indicators signal a potential trend reversal.
ENS eyes extended gains as bullish momentum increases
ENS appreciates nearly 9% at press time, printing its fourth consecutive bullish candle on the daily chart. The altcoin reaches a five-month high, edging above the $24.88 level, last tested on June 11.
A positive close above this level could stretch the trend reversal rally to the $28.29 level, last tested on February 23.
The 50-day Exponential Moving Average (EMA) inches closer to surpassing the 100-day EMA. Typically, sidelined investors could consider this a buy signal.
The Moving Average Convergence/Divergence (MACD) indicator suggests increased bullish momentum as histogram bars surge above the zero line.
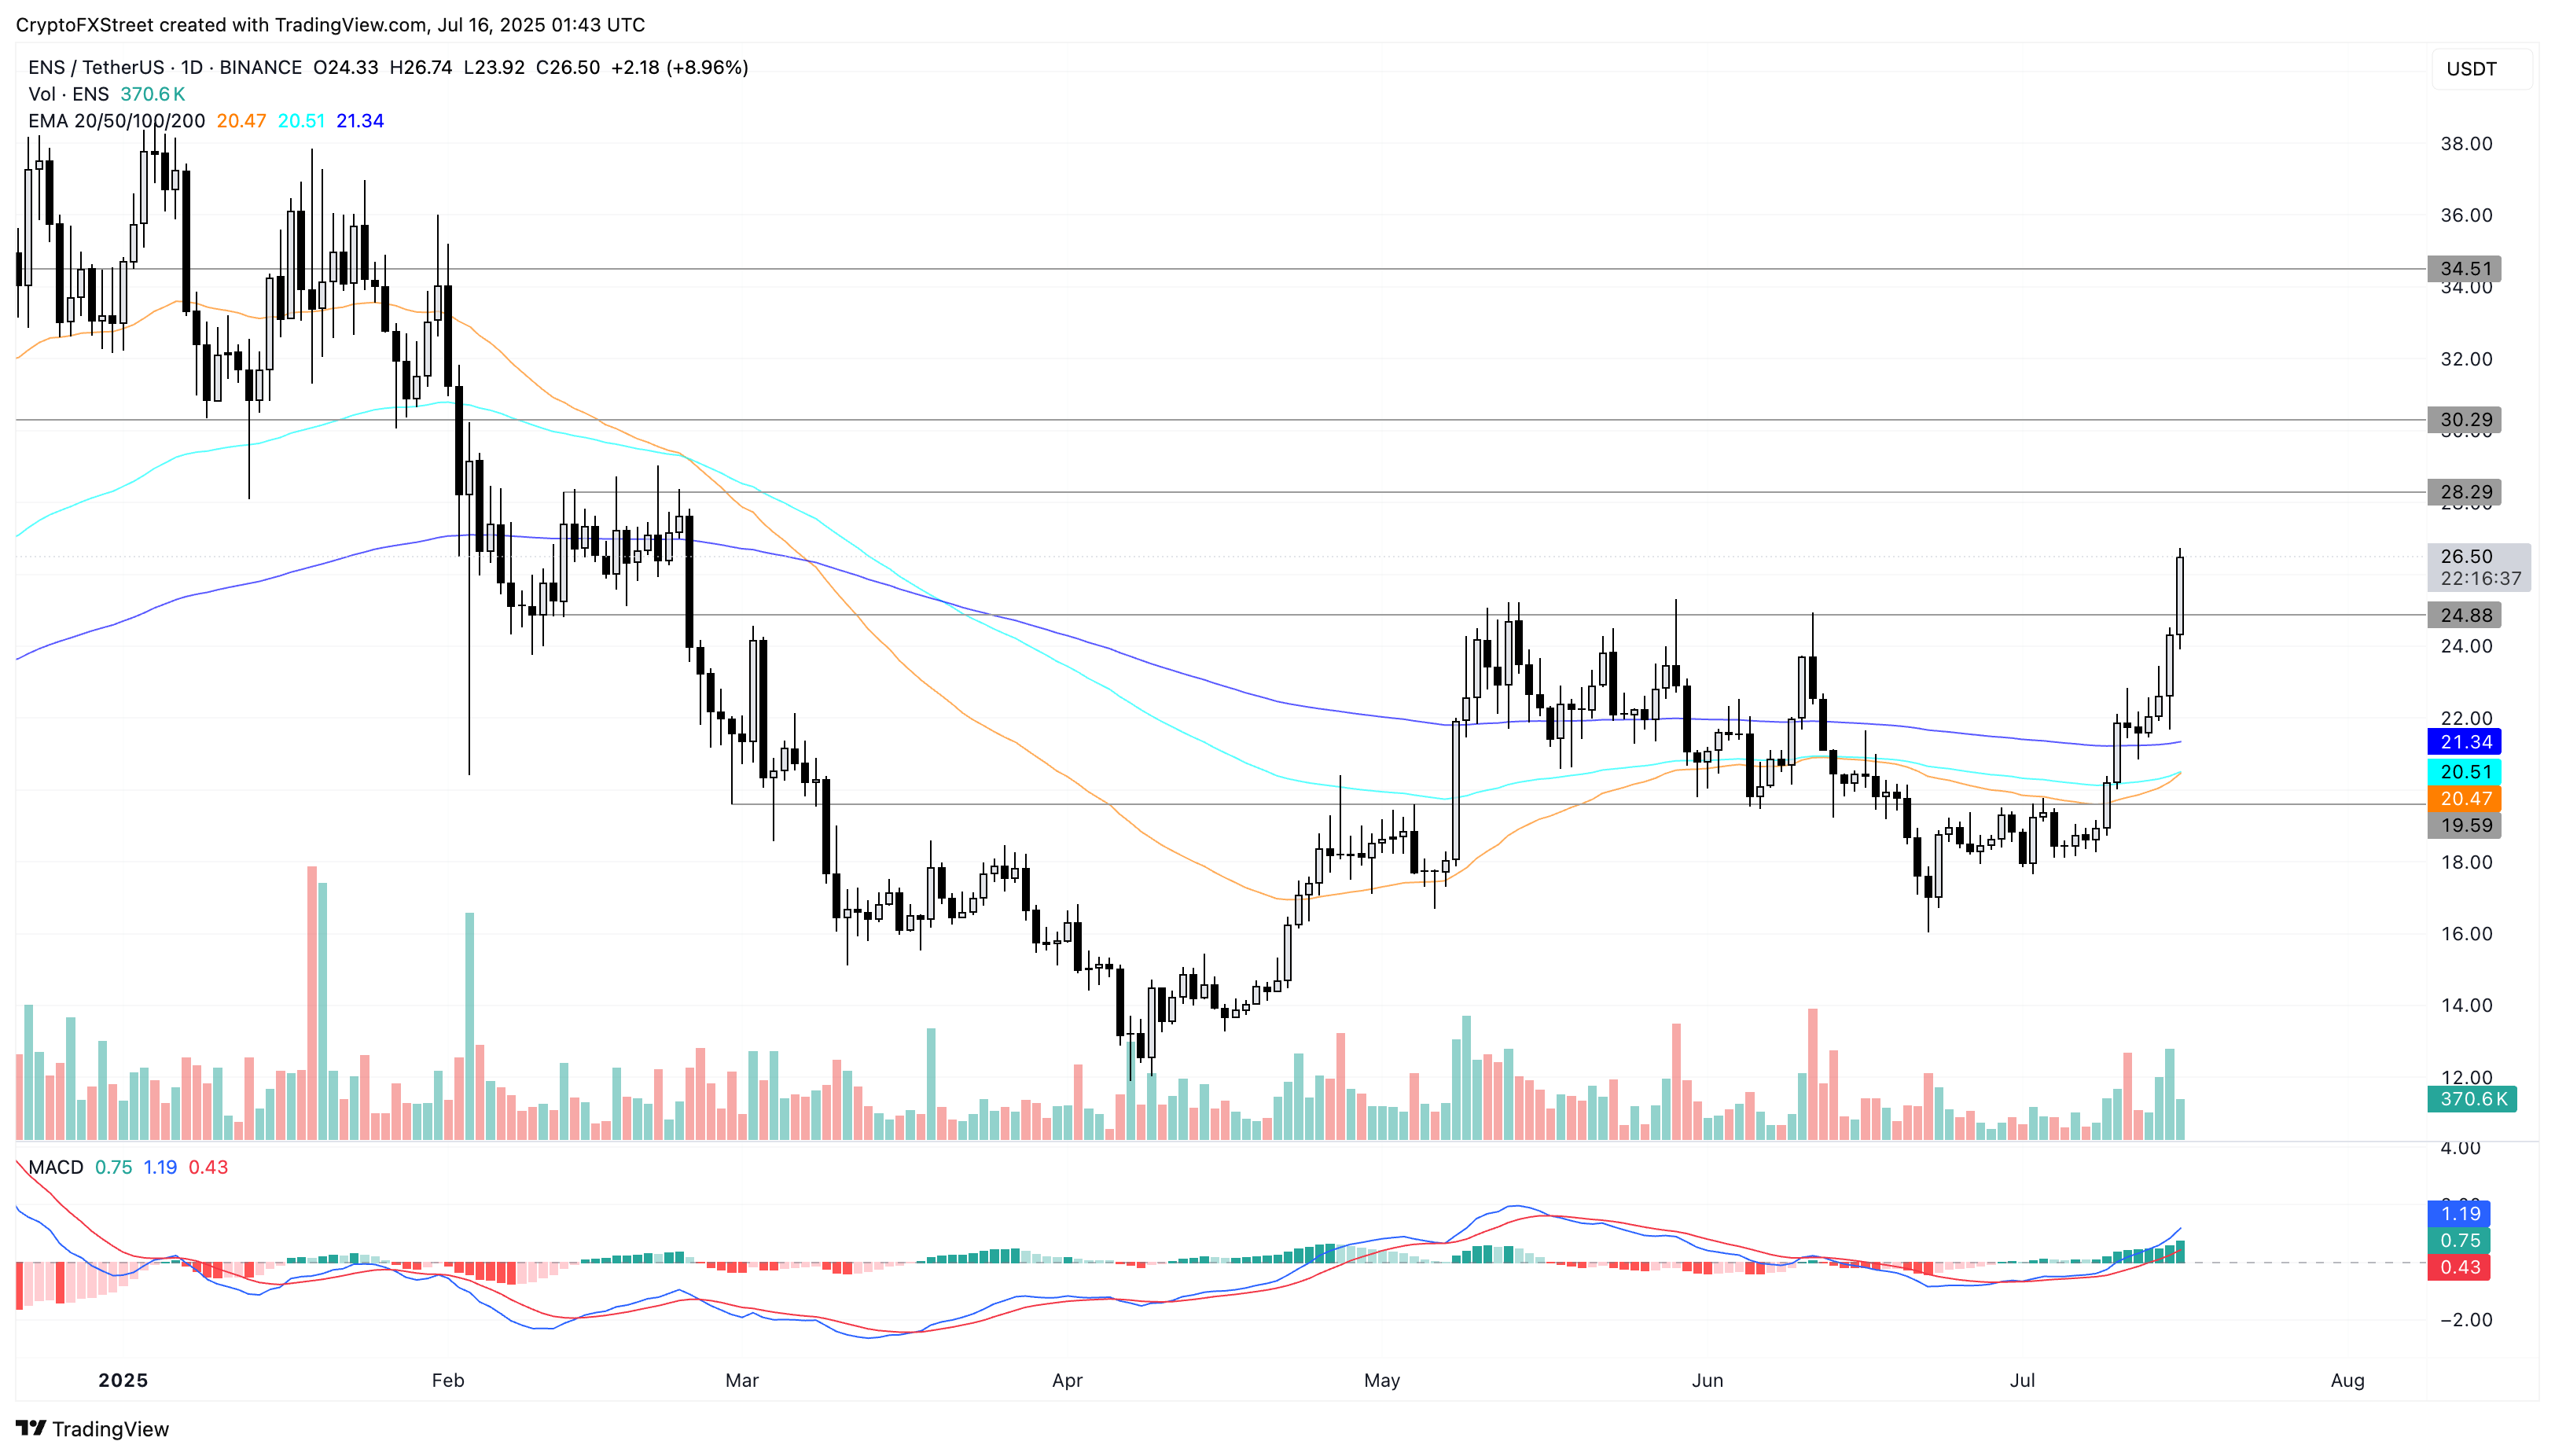
ENS/USDT daily price chart.
If ENS fails to uphold dominance above $24.88, it could extend the decline to test the 200-day EMA at $21.33.
Curve DAO aims to surpass the $0.80 resistance level
CRV edges higher by 4% so far on Wednesday, maintaining its uptrend for the fourth consecutive day. The uptrend targets the 50% Fibonacci retracement level at $0.80, drawn from the $1.24 close on December 6 to the $0.36 close on March 10.
A daily close above this level could extend the uptrend to the 61.8% Fibonacci level at $0.91.
The 50-day and 200-day EMAs exhibit a golden crossover, indicating a trend reversal as the short-term trend surpasses the longer-term trend.
The MACD and its signal line crossing above the signal line and green histogram bars rising from the same line indicate a surge in bullish momentum.
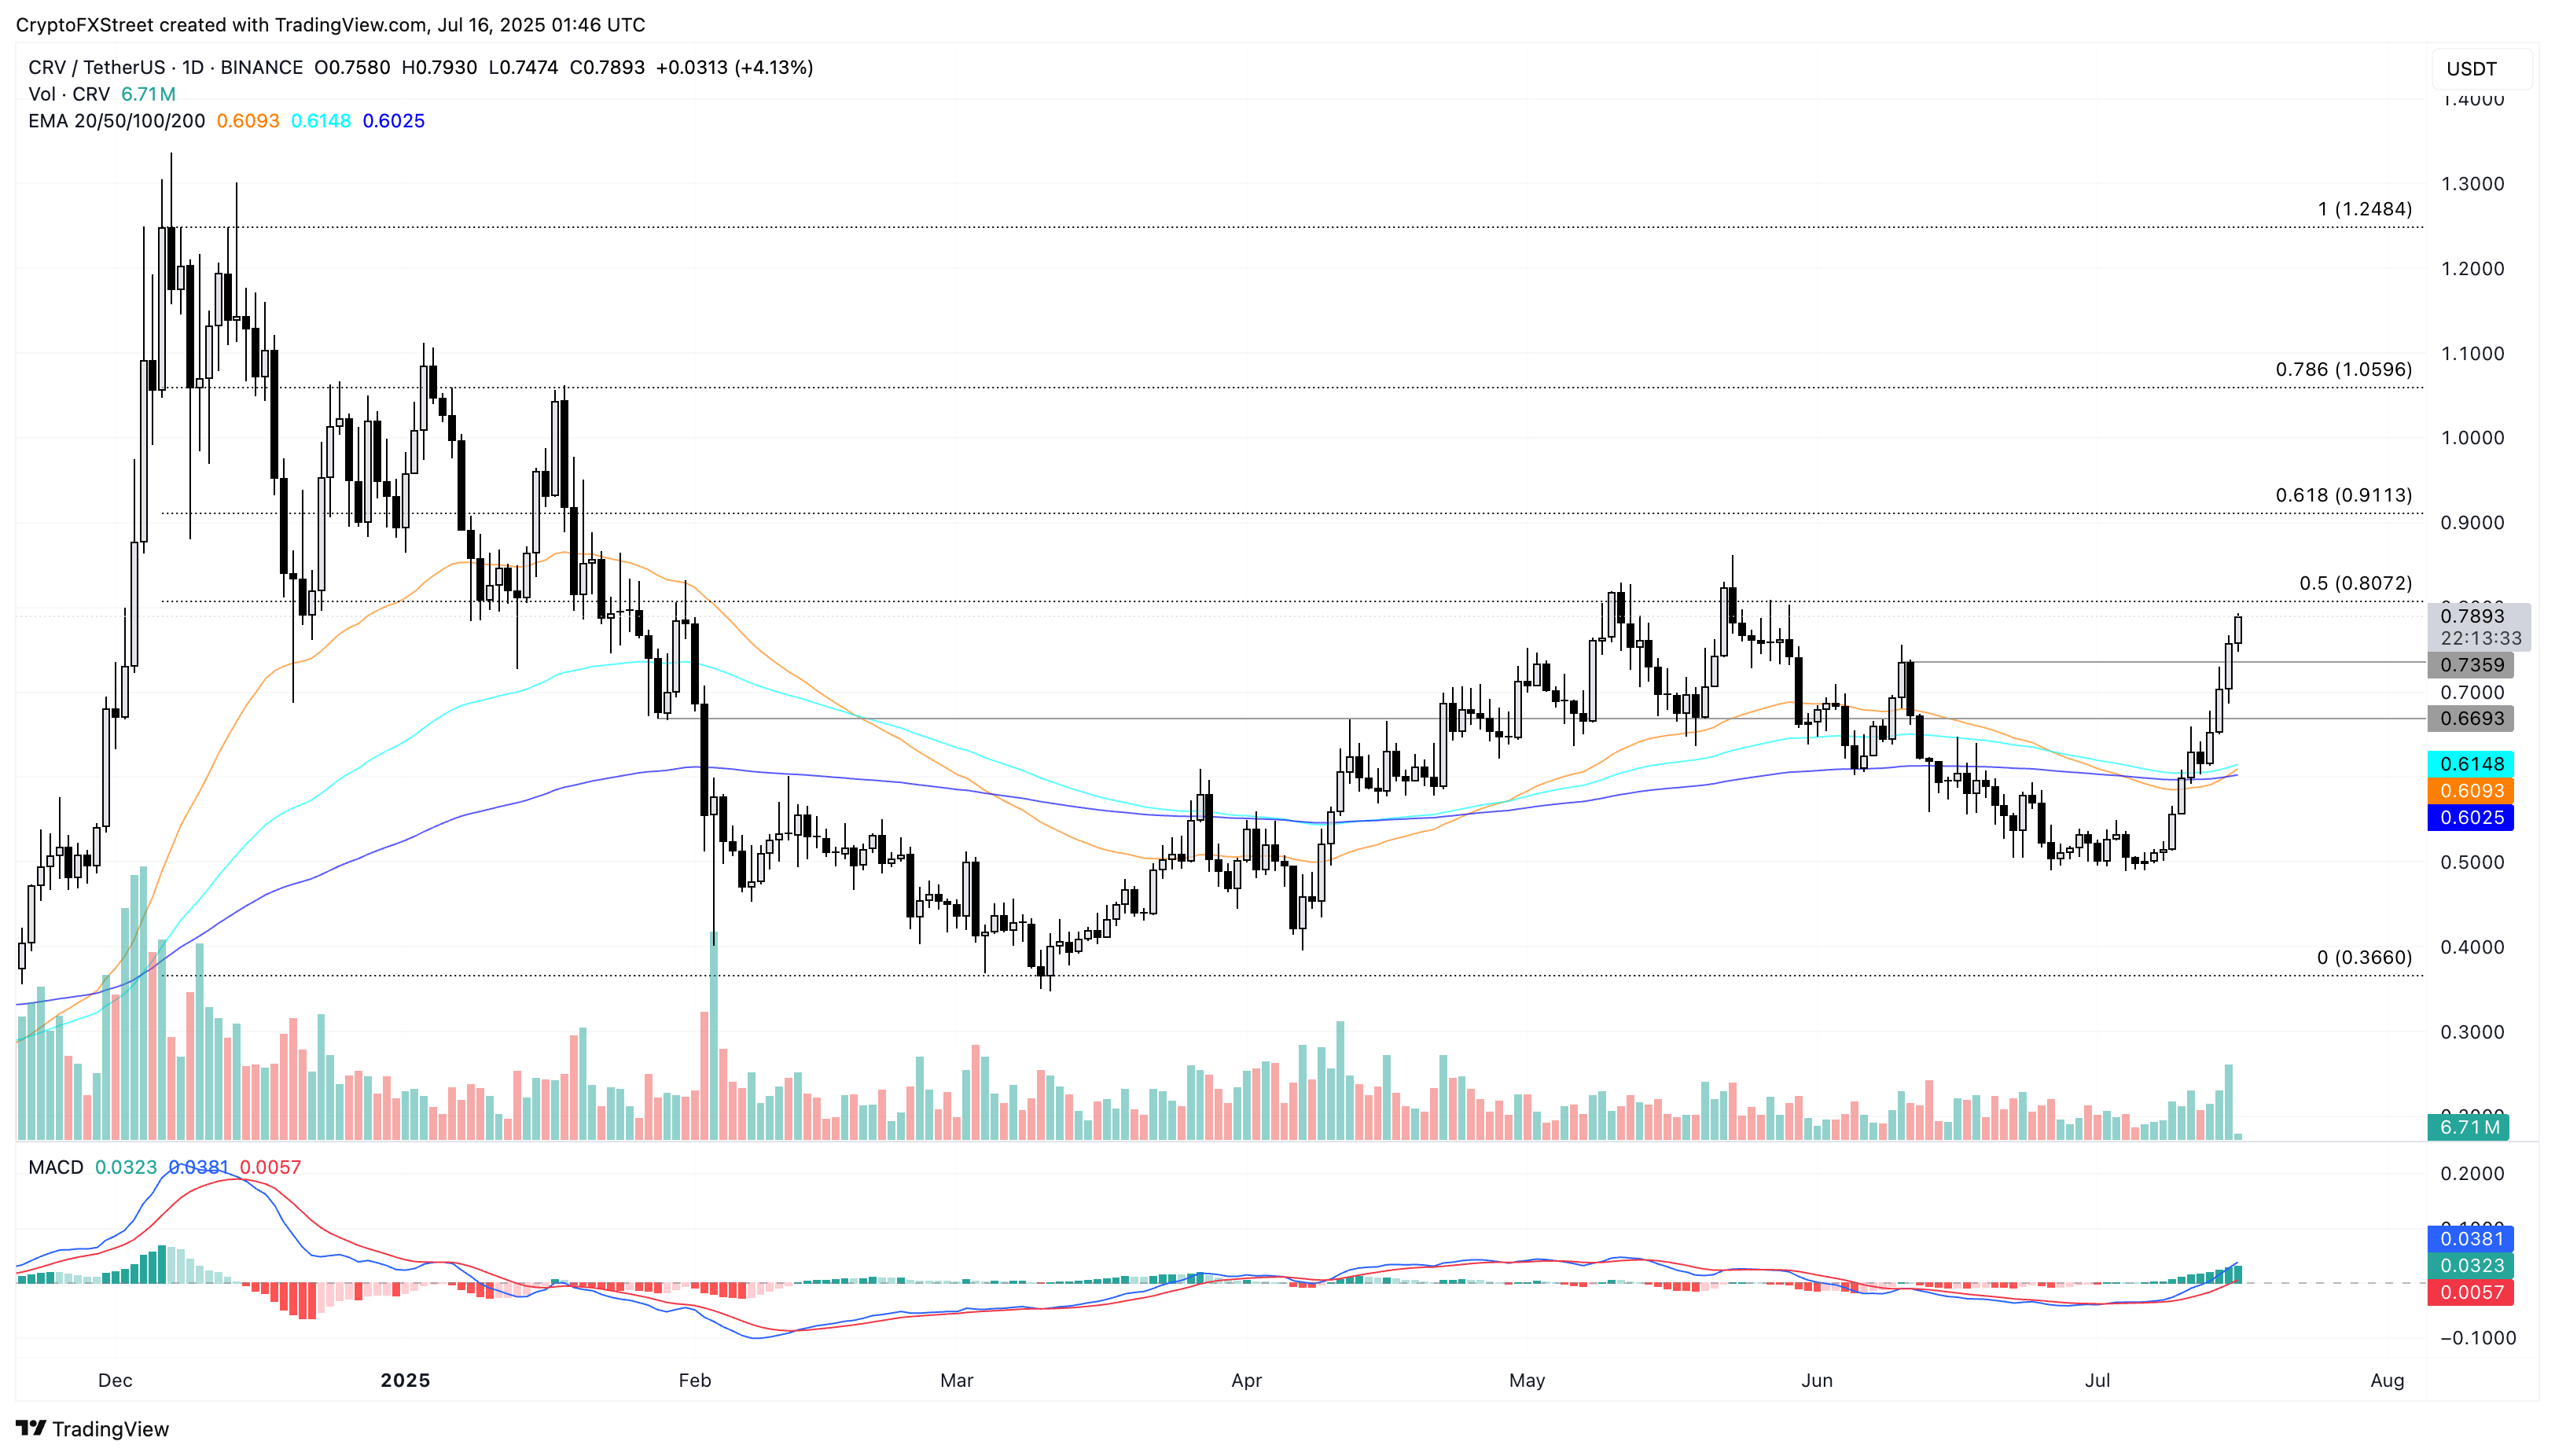
CRV/USDT daily price chart.
On the downside, a reversal in CRV from the 50% Fibonacci level at $0.80 could result in a pullback to the $0.73 level marked by the June 10 daily close.
SEI targets further gains with a resistance breakout
SEI edges higher by 1% at press time on Wednesday, holding the 10% gains from Tuesday. The altcoin hits a six-month high as it exceeds the $0.3642 resistance, last tested on January 21.
A decisive bullish candle above this level could extend the uptrend to the $0.4804 level, the year-to-date high.
The rising 50-day EMA inches closer to the 200-day EMA, hinting at a golden cross. The MACD crosses above its signal lines, accompanied by increasing green histograms that move above the zero line, signaling a boost in bullish momentum.
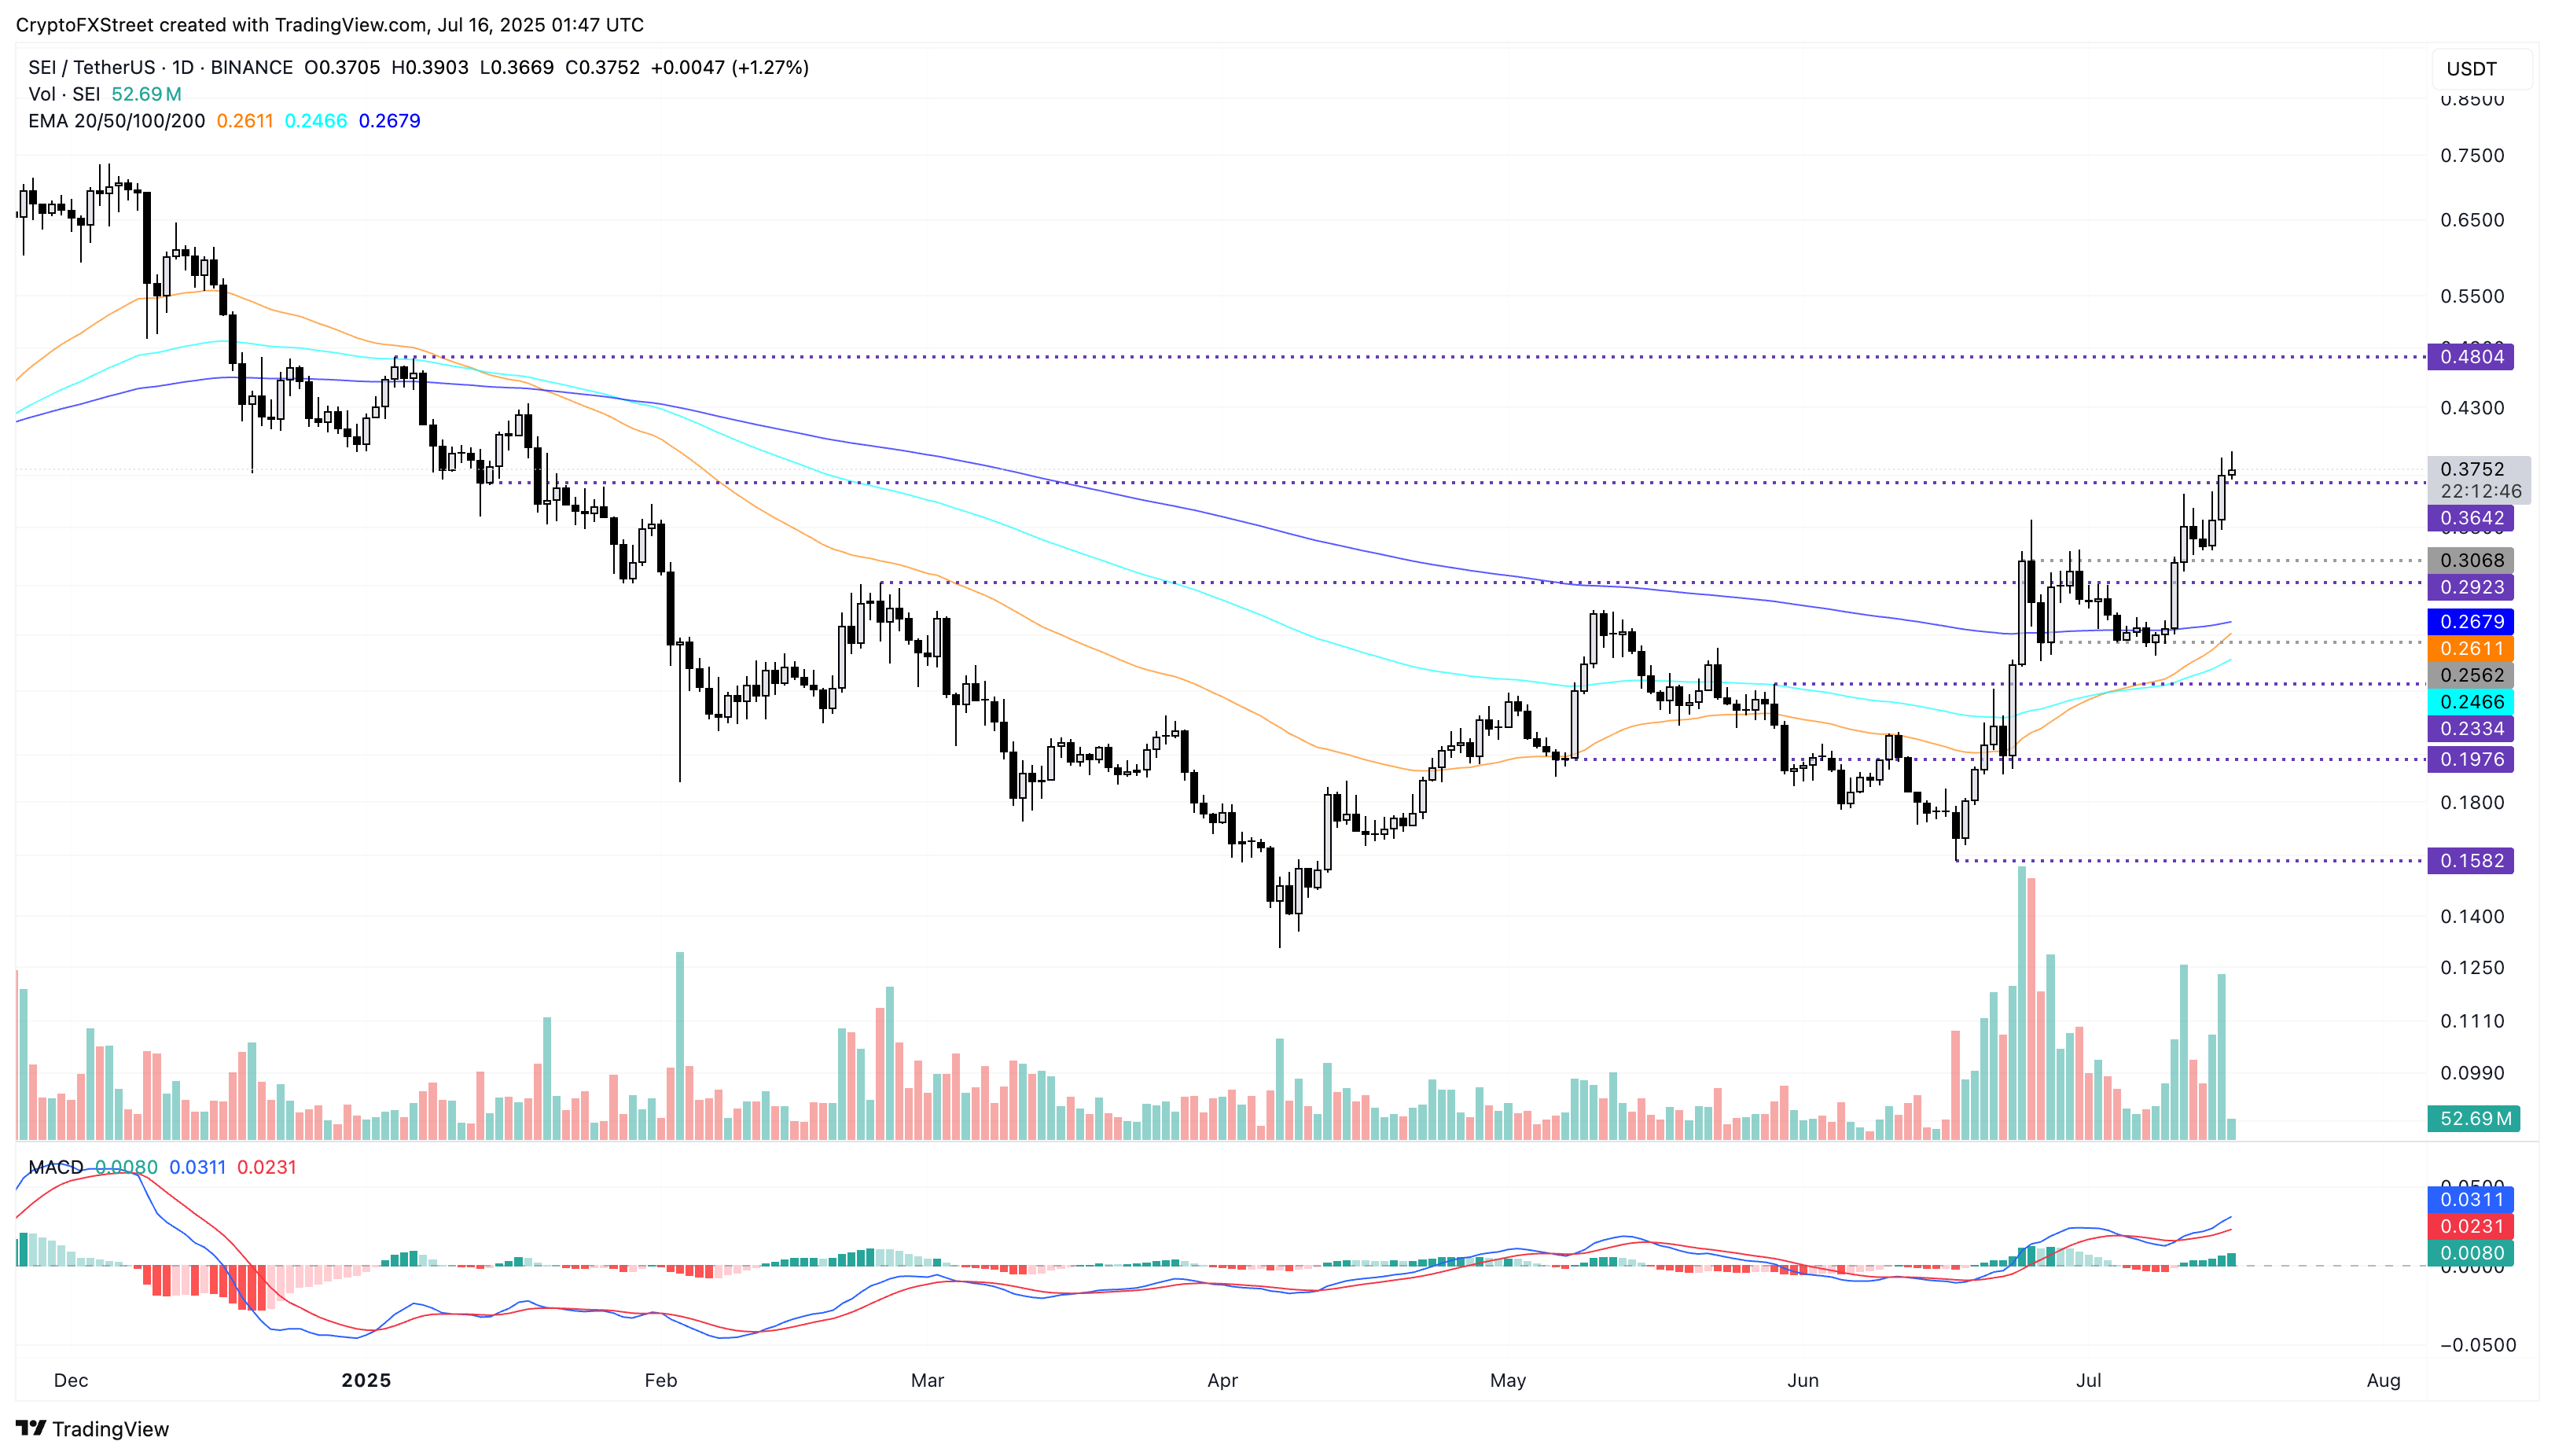
SEI/USDT daily price chart.
On the contrary, if SEI marks a close below $0.3642, it could retest the $0.3066 level, marked by the high of June 24.
Artigos Recomendados


