

MATIC price eyes a 10% climb as Polygon tech’s Immutable zkEVM Mainnet early access goes live
- Polygon price Vv-shaped recovery is gaining steam despite overhead pressure.
- MATIC could rise 10% to the supply zone if it manages to overcome the SMA barricades.
- The bullish thesis will be invalidated if the Layer 2 token breaks and closes below $0.7390.
Polygon (MATIC) price continues to push north despite growing overhead pressure. It shows no signs of stopping with multiple technical indicators in support as bulls buy the news of Polygon technology’s Immutable zkEVM mainnet going live for its early access.
Also Read: MATIC price eyes 5% climb amid reports that Polygon gained over 15 million new users last year
Polygon tech enables Web3 gaming ecosystem
Polygon (MATIC) price is rising on the back of the blockchain’s technology enabling Web3 gaming ecosystem. As reported, Immutable zkEVM Mainnet has launched for early access, “giving game studios the power to revolutionize player experiences, enhance security, and unlock new revenue streams.”
With it, Polygon Labs has also launched an official Mirror.xyz account with Writing NFTs now available for minting on Polygon Proof-of-Stake (PoS). Mirror is a Web3 publishing platform committed to giving projects and their respective audiences a closer two-way connection.
As part of that move, the governance team at Polygon Labs is also launching its own channel on Mirror, with the network making it accessible to interested members of the Polygon community, specifically the ones that participate in decentralized decision-making, system design, as well as protocol and treasury governance.
Polygon price outlook as MATIC contends against overhead pressure
MATIC price is broadly bullish, up 20% after bouncing from the lower boundary of the range at $0.7390. The Relative Strength Index (RSI) is rising, showing momentum is increasing. The Moving Average Convergence Divergence (MACD) has also crossed above its signal line (orange band) whereas the Awesome Oscillator (AO) is recording green histogram bars that are steadily edging towards positive territory. This favors the upside.
Enhanced buyer momentum could see Polygon MATIC price overcome the resistance due to the 100-day Simple Moving Average (SMA) at $0.8101 before confronting the 50-day SMA at $0.8511. Overcoming these blockades would bring the supply zone into focus, extending from $0.8828 to $0.9274. A break and close above its midline at $0.9047 would confirm the continuation of the intermediate trend.
In a highly bullish case, the MATIC price could flip the supply zone into a bullish breaker, confirmed by a break and close above the $0.9702 resistance level. This would denote a 20% climb above current levels, with the cryptocurrency likely to tag the $1.0000 psychological level.
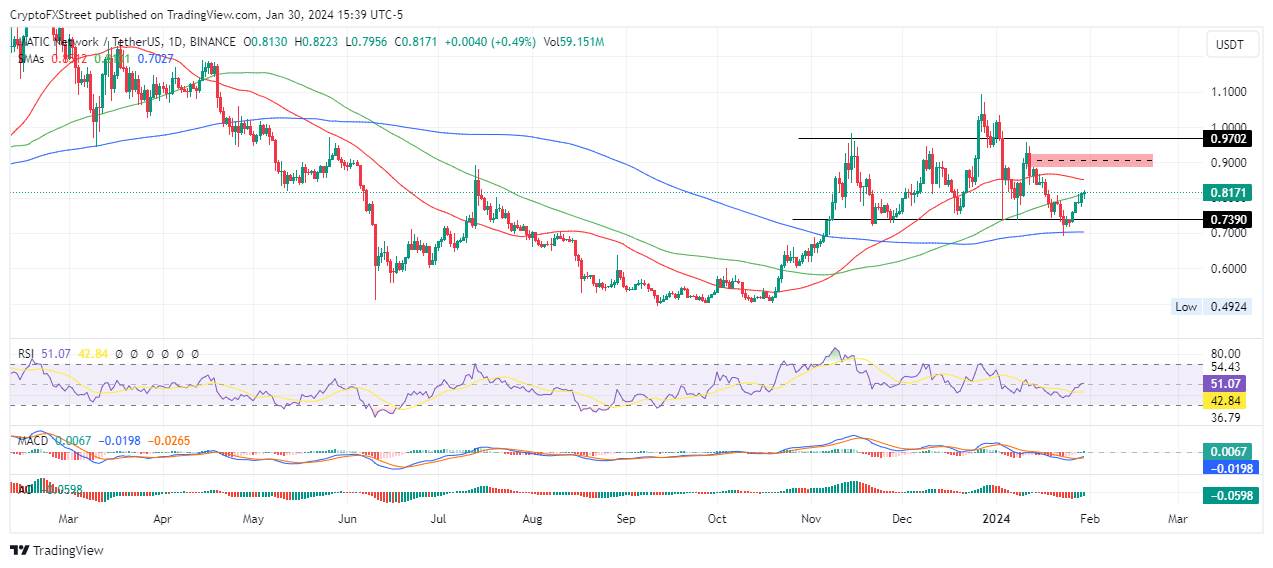
MATIC/USDT 1-day chart
On the other hand, after the 17% climb since the January 23 low of $0.6913, profit booking appetite is likely to creep in. Traders succumbing could see MATIC price fall, with the rejection from the 100-day SMA sending Polygon price to the $0.7390 support. A break and close below this level would invalidate the bullish thesis.
If the aforementioned buyer congestion level fails to hold as a support, Polygon price could extend a leg down to the 200-day SMA at $0.7027.
Artigos Recomendados


