


Dogecoin Price Forecast: Extends gains as ETF inflows return and momentum improves
- Dogecoin trades above $0.088 on Monday, having rallied nearly 6% last week.
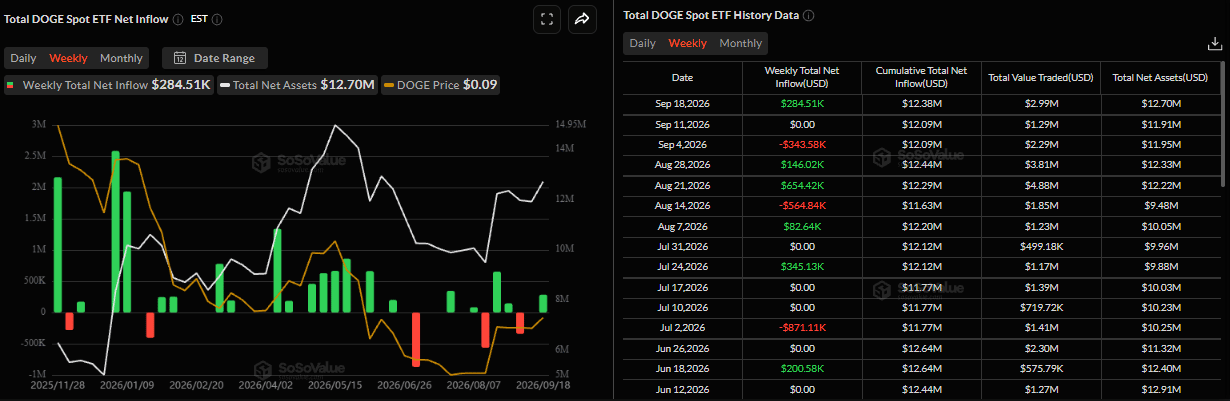
- US-listed spot ETFs recorded $284,510 in inflows last week after remaining muted in mid-September.
- Improving momentum indicators, along with certain whale accumulations, suggest a bullish bias.
Dogecoin (DOGE) extends its recovery, trading above $0.088 on Monday after gaining nearly 6% last week. The bullish price outlook is supported by the return of institutional demand through DOGE spot Exchange Traded Funds (ETFs). Meanwhile, improving momentum indicators and signs of whale accumulation suggest a positive outlook for the dog-themed meme coin.
Institutional demand returns
SoSoValue data showed that spot DOGE ETFs recorded an inflow of $284,510 last week after remaining muted in mid-September.
These mild inflows suggest early signs of returning institutional demand after a quiet period, but they also indicate investors remain cautious. Moreover, if the inflows continue and intensify this week, they could provide additional support for DOGE and strengthen its recovery momentum.
Whales buying DOGE
Santiment’s Supply Distribution data shows certain large-wallet holders (whales) buying DOGE meme coins, supporting a positive outlook for the token.
The metric indicates that whales holding between 10 million and 100 million DOGE tokens (blue line) and 100,000 and 1 million DOGE tokens have accumulated 120 million dog-themed meme coins since Thursday. During the same period, 1 million and 10 million (yellow line) have shed 90 million tokens. This indicates that accumulation among larger and smaller whale cohorts has outweighed selling from the mid-sized cohort, suggesting a mixed but broadly supportive accumulation trend for DOGE.
 [09-1789970572061.44.26, 21 Sep, 2026].png)
Some signs of concerns
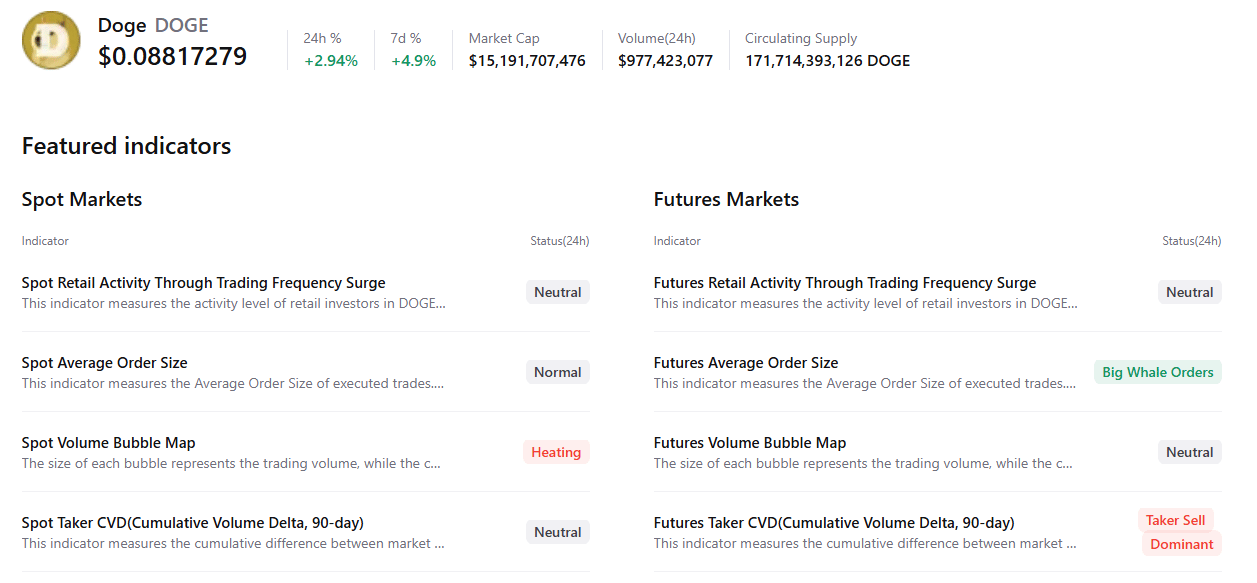
CryptoQuant’s summary data shows mildly cautious signs. DOGE’s futures markets show large whale orders; however, it also shows sell-side dominance. In addition, spot markets show heating conditions while other metrics remain neutral, highlighting a mildly bearish, cautious sentiment bias among the meme coin traders.
Dogecoin technical outlook: Rebounds from strong support zone
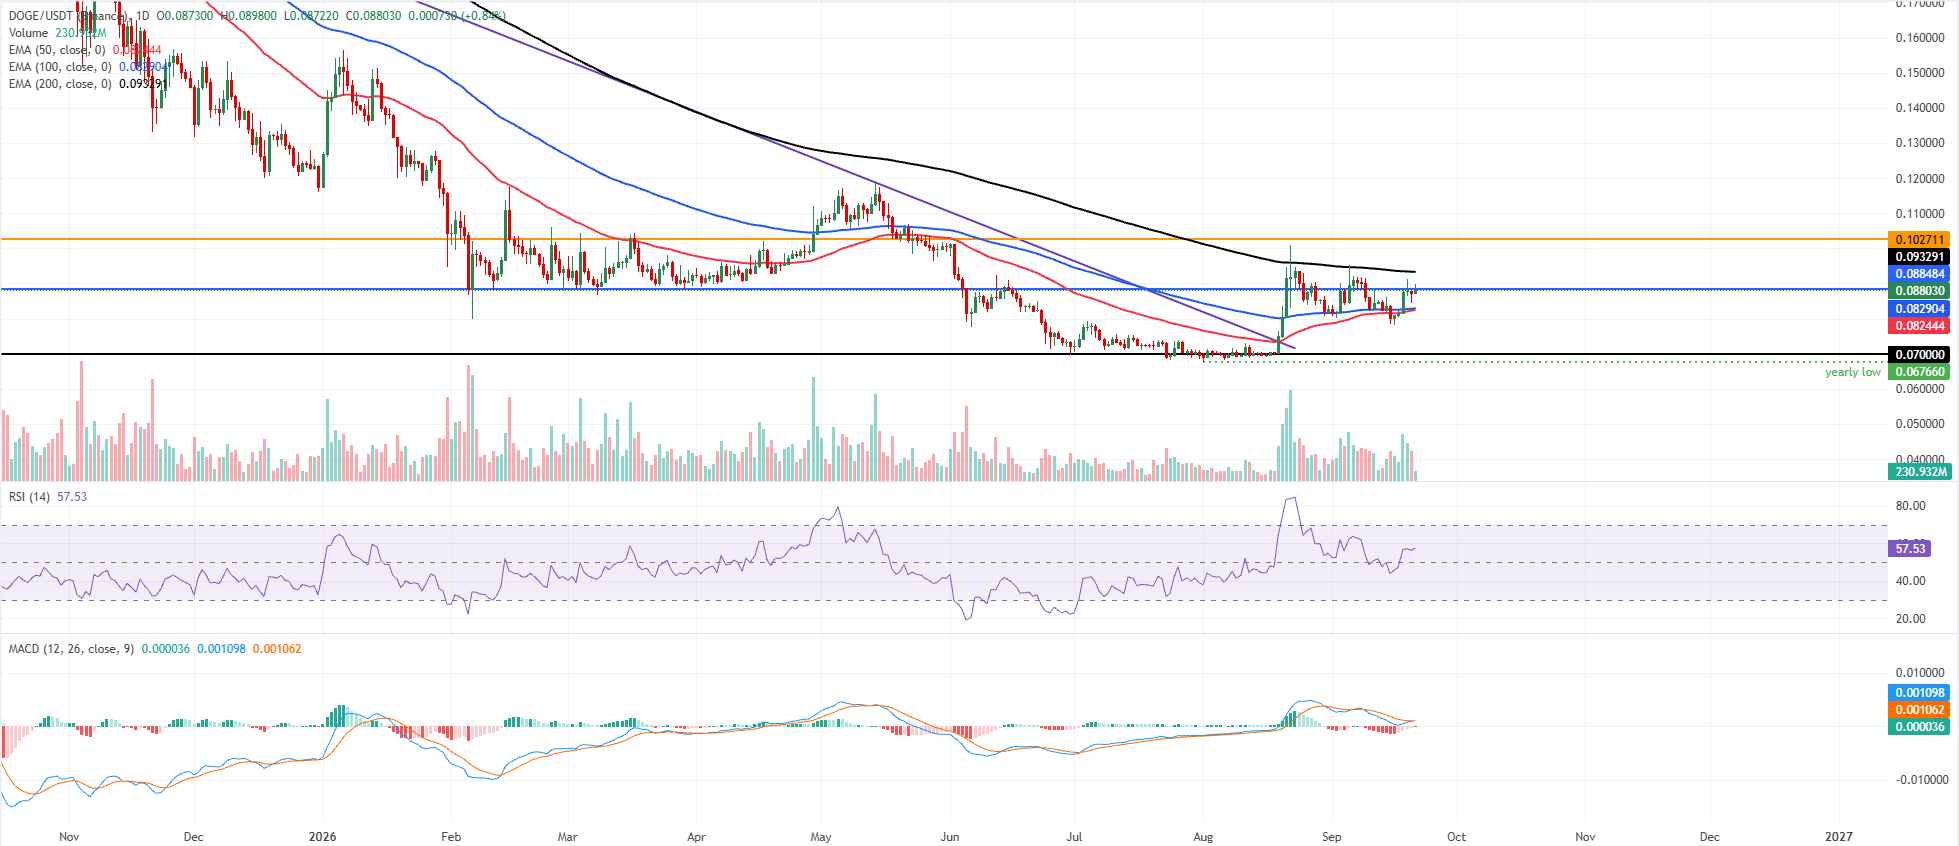
Dogecoin price trades at $0.088 on Monday after gaining nearly 6% last week. DOGE maintains a mildly bullish outlook as it holds above the 50-day and 100-day Exponential Moving Averages (EMAs) at roughly $0.082, but remains clearly below the 200-day EMA near $0.093.
This setup suggests an improving medium-term base within a broader corrective context, with the Relative Strength Index (RSI) hovering in the mid-50s and the Moving Average Convergence Divergence (MACD) fluctuating around the zero line, hinting at waning upside momentum as price hesitates under the longer-term trend gauge.
On the topside, immediate resistance aligns with the recent horizontal cap at $0.088, with the 200-day EMA at $0.093 as the next key barrier before a more substantial hurdle at the prior horizontal resistance around $0.102.
On the downside, initial support comes from the 100-day EMA and the 50-day EMA roughly around $0.082. At the same time, a deeper pullback would expose the horizontal floor near $0.070, which buyers would need to defend to preserve the nascent basing structure.
(The technical analysis of this story was written with the help of an AI tool. Know more.)
Artigos Recomendados


