

Terra Luna Classic Price Forecast: LUNC extends rally as rising inflows, upgrade momentum fuel bullish outlook
- Terra Luna Classic price hovers around $0.000061 on Wednesday after rallying over 22% in the previous two days.
- Rising open interest and net inflows support bullish sentiment, likely linked to the upcoming network upgrade.
- The technical outlook suggests further upside, with LUNC eyeing a potential continuation rally toward $0.000081 and beyond.
Terra Luna Classic (LUNC) is showing renewed strength, trading above $0.000061 at the time of writing on Wednesday, up more than 22% this week. Rising net inflows, growing open interest, and optimism surrounding the upcoming network upgrade are further fueling the bullish momentum. On the technical side, it projects further upside, with bulls targeting levels above $0.000081.
Bullish on-chain signals emerge ahead of the network upgrade
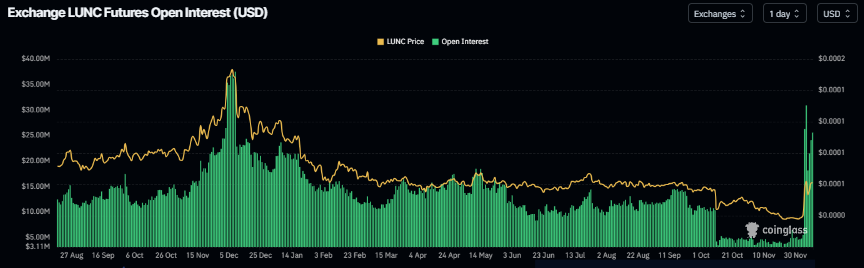
Terra Luna Classic price begins the week on a positive note, extending its upward momentum after rallying over 84% in the previous week. The derivatives data further support these ongoing gains, as LUNC futures OI at exchanges rose from $18.15 million on Monday to $25.55 million on Wednesday. Rising OI represents new or additional money entering the market and new buying, which could fuel the current LUNC price rally.
Earlier this Sunday, Terra Classic developers released terrad v3.6.1, an update that addresses legacy contract issues and updates dependencies. The proposal seeks community and validator approval to upgrade the chain to v3.6.1 (upgrade name: v13_1), triggering an automatic chain halt at block 26,479,000, estimated for December 18.
According to the GitHub documentation, the upgrade was successfully tested on the rebel-2 testnet, with a rollback option available via v3.6.0 if mainnet issues arise.
Once implemented, this upgrade is expected to bolster the security, functionality, and reliability of the Terra Classic blockchain, thereby strengthening the network's long-term resilience and utility.
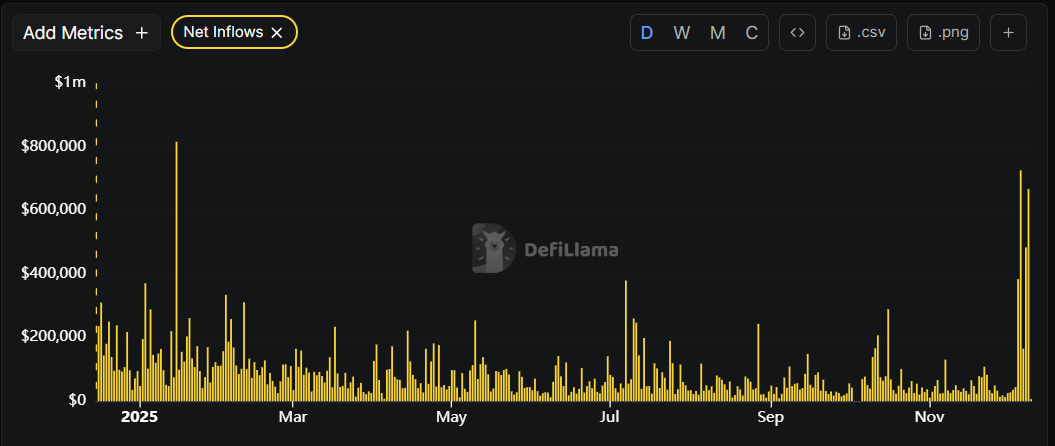
DefiLlama chart below also shows multiple inflow spikes, signaling renewed investor confidence and increased capital entering the ecosystem—likely linked to the upcoming network upgrade.
Terra Luna Classic Price Forecast: LUNC bulls targeting further gains
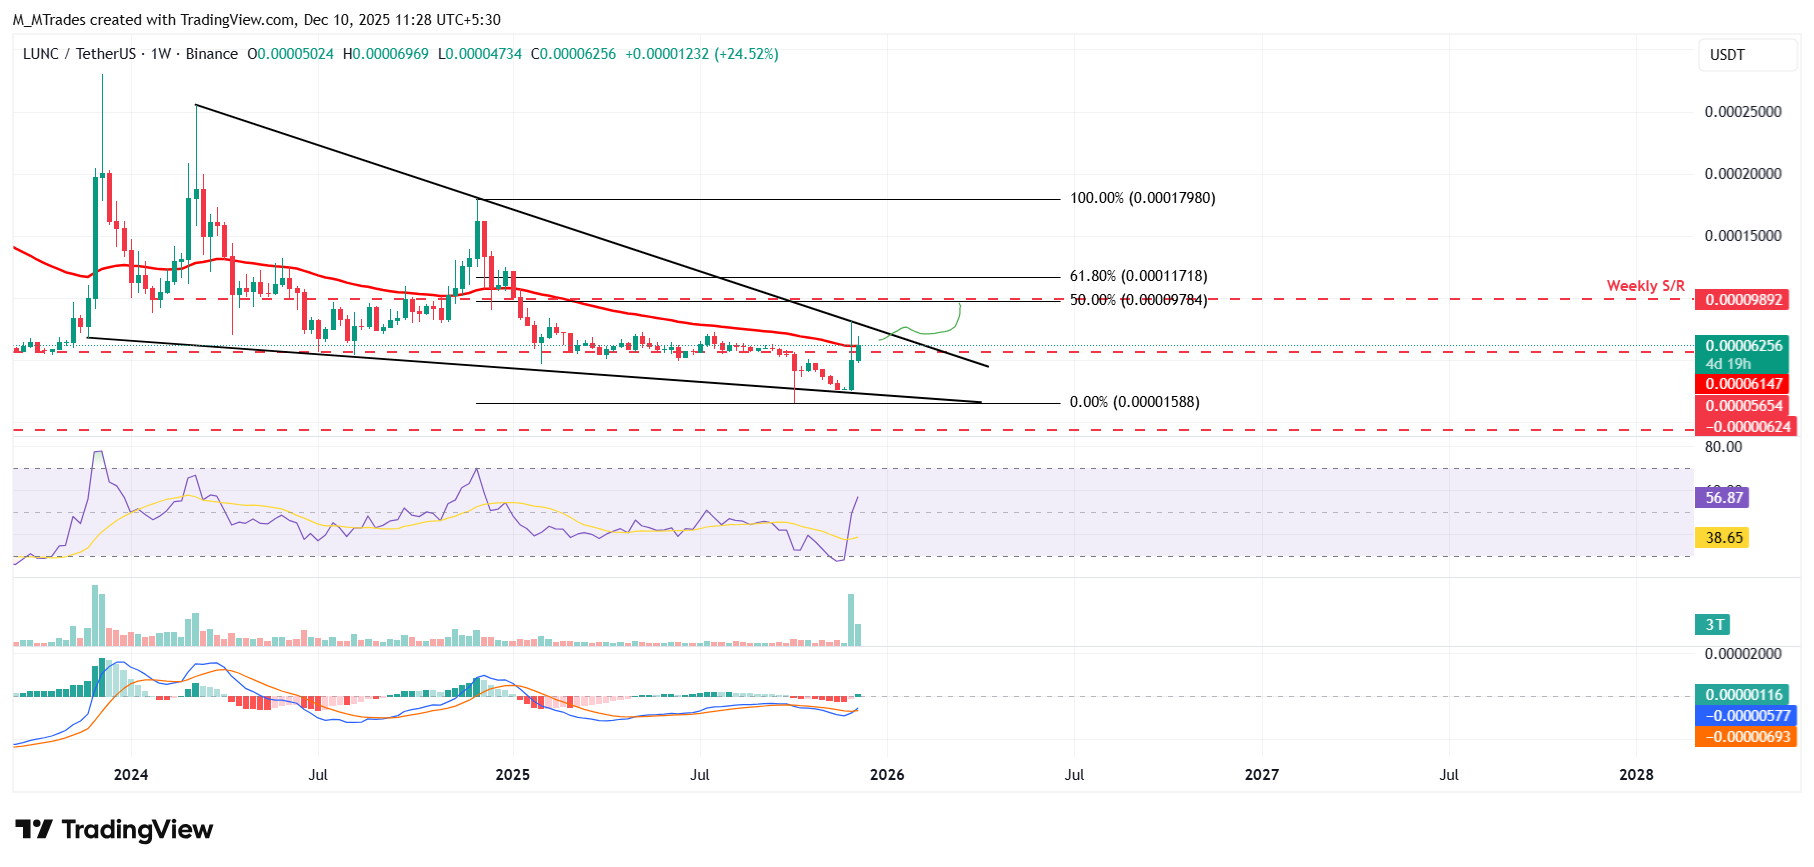
Terra Luna Classic weekly chart trades inside a falling wedge pattern and is currently trading above the 50-week Exponential Moving Average (EMA) level at $0.000056 after gaining 24% so far this week.
If LUNC closes above the 50-week EMA at $0.000056 on a weekly basis, it could extend the rally toward the next weekly resistance at $0.000098.
The Relative Strength Index (RSI) on the weekly chart is 56, above the neutral 50 level, indicating bullish momentum is gaining traction. Additionally, the Moving Average Convergence Divergence (MACD) on the weekly chart showed a bullish crossover, further supporting the bullish view.
On the daily chart, LUNC price found support around the 61.8% Fibonacci retracement level at $0.000047 (from the December 2 low of $0.000026 to the December 6 high of $0.000081) on Monday and rose 22% the next day. At the time of writing on Wednesday, LUNC hovers at around $0.000061.
If LUNC continues its upward trend, it could extend the rally toward the December 6 high at $0.000081.
The RSI on the daily chart is at 71, above the overbought conditions, indicating strong bullish momentum. The MACD also showed a bullish crossover and rising green histogram bars, suggesting bullish momentum and continuation of an upward trend.
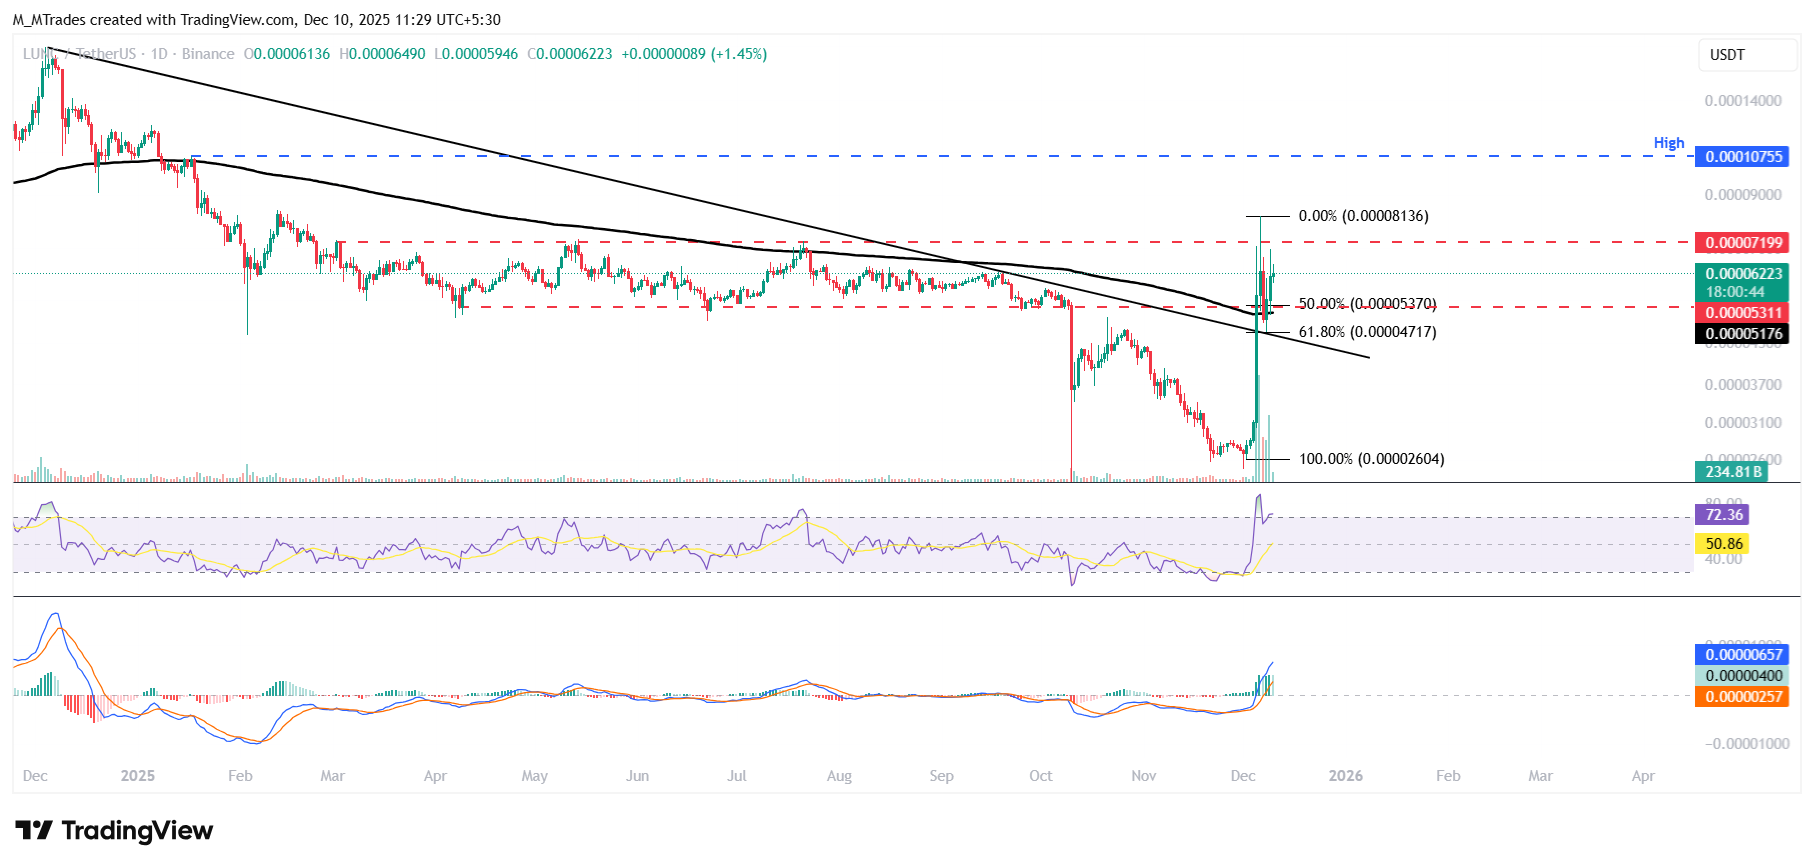
On the other hand, if LUNC corrects, it could extend the decline toward the next key support at $0.000047.
Artigos Recomendados


