
Gold Price Forecast: XAU/USD remains afloat as fears mount
XAU/USD Current price: $3,383.60
- US President Donald Trump says patience with Iran “wearing thin.”
- United States data came in below expected as markets gear up for the Fed.
- XAU/USD trades within a well-limited range amid renewed risk aversion.
Spot Gold set a weekly low of $3,366.25 on Tuesday, bouncing from the level yet in the American session. The US Dollar (USD) spent the first half of the day on the back foot, but remained within familiar levels as market players awaited United States (US) macroeconomic figures, while being cautious amid the Middle East crisis.
The US published May Retail Sales, which fell by 0.9% on a monthly basis, worse than the -0.1% posted in April and the -0,7% expected. Additionally, Industrial Production in the same period was down by 0.2% against the 0.1% advance anticipated. Finally, Capacity Utilization stood at 77.4%, down from the 77.7% posted in April and missing the 77.7% expected.
Additionally, trade-war-related headlines kept coming. On the one hand, European Commission President Ursula von der Leyen noted trade talks with the US are “advancing” despite being complex, while adding the EU has a trade surplus with the US, and that could last.”
Finally, it is worth adding comments from the US President about the Middle East conflict, which fueled risk-off, helping XAU/USD trim intraday losses. Trump claimed the US military has full control of the Iranian airspace, adding that US patience “is wearing thin.”
Discouraging US data and renewed Middle-East-related concerns fuel demand for safety.
In the meantime, the US Federal Reserve (Fed) is expected to keep interest rates on hold when it announces its monetary policy decision on Wednesday. US officials will also present a fresh Summary of Economic Projections (SEP), with fresh inflation, growth and employment perspectives.
XAU/USD short-term technical outlook
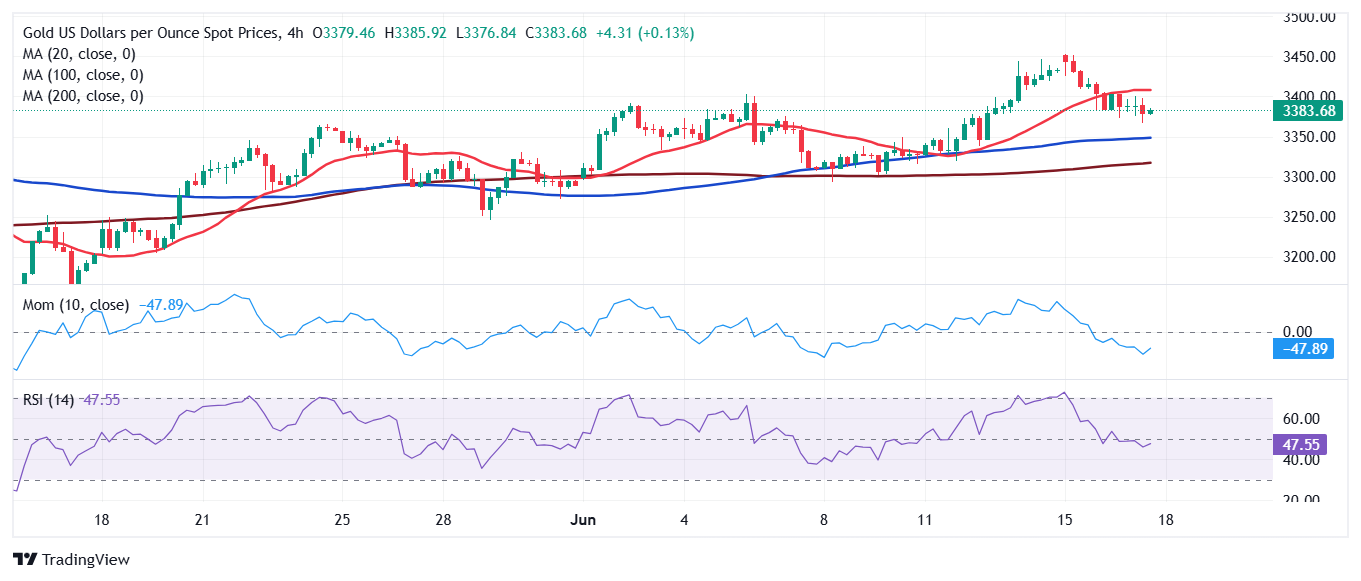
The XAU/USD pair trades in the $3,380 region, and the daily chart shows it has spent the journey confined to a tight range. The pair has lost its positive momentum, but the overall risk skews to the upside, given that technical indicators have turned flat well above their midlines. Additionally, XAU/USD develops above all its moving averages, with the 20 Simple Moving Average (SMA) partially losing its bullish strength, yet holding far above bullish 100 and 200 SMAs.
In the near term, and according to the 4-hour chart, Gold price has room to ease further. The pair trades below its 20 SMA, which caps advances at around $3,406.90. The 100 and 200 SMAs remain directionless below the current level, while technical indicators grind lower within negative levels. Still, the risk-averse environment will likely prevent the pair from falling further.
Support levels: 3,366.10 3,352.40 3,339.75
Resistance levels: 3,406.90 3,414.60 3,437.85
Artigos Recomendados


