

Gold price retreats from one-month peak amid bullish USD, elevated US bond yields
- Gold price kicks off the week on a softer note and pulls back from a one-month top set on Friday.
- Hawkish Fed expectations, elevated US bond yields and a bullish USD weigh on the precious metal.
- The risk-off mood could offer support to the safe-haven XAU/USD pair and help limit further losses.
Gold price (XAU/USD) attracts some sellers during the Asian session on Monday and for now, seems to have snapped a four-day winning streak to the $2,700 neighborhood, or a one-month high touched on Friday. The upbeat US Nonfarm Payrolls (NFP) report reinforced market expectations that the Federal Reserve (Fed) will pause its rate-cutting cycle later this month. This keeps the US Treasury bond yields elevated near their highest level in over a year and the US Dollar (USD) near a two-year peak, which, in turn, exerts some pressure on the non-yielding yellow metal.
Meanwhile, hawkish Fed expectations, along with persistent geopolitical tensions, dampen investors' appetite for riskier assets. This is evident from a weaker tone around the equity markets and should offer some support to the safe-haven Gold price. Hence, it will be prudent to wait for strong follow-through selling before confirming that the XAU/USD's move-up witnessed over the past three weeks or so has run its course and positioning for any meaningful corrective decline. Investors now look forward to this week's release of the US inflation figures for some meaningful impetus.
Gold price drifts lower as upbeat US NFP reaffirms bets that the Fed will slow its rate-cutting cycle
- The US Bureau of Labor Statistics (BLS) reported on Friday that Nonfarm Payrolls rose by 256,000 in December, well above the 212,000 in the previous month and market expectations for a reading of 160,000.
- Other details of the report showed that the Unemployment Rate unexpectedly ticked lower to 4.1% from 4.2% and annual wage inflation, as measured by the change in the Average Hourly Earnings, declined to 3.9%.
- This comes on top of the Federal Reserve's (Fed) hawkish shift in December and dampens hopes for further interest rate cuts by the US central bank, pushing the US Treasury bond yields and the US Dollar higher.
- The yield on the benchmark 10-year US government bond has spiked to its highest level since late 2023, while the USD Index, which tracks the Greenback against a basket of currencies, shot to over a two-year peak.
- Elevated US bond yields and a bullish USD act as a headwind for the Gold price on Monday, though the risk-off mood lends some support to the safe-haven bullion and helps limit any meaningful corrective slide.
- The Office of Foreign Assets Control (OFAC) said on Friday that the US and the UK administration imposed tougher sanctions against Russia's oil industry, targeting nearly 200 vessels of the so-called shadow fleet.
- The Russian Defence Ministry said on Sunday that Russian forces have carried out strikes on Ukrainian military airfields, personnel and vehicles in 139 locations using its air force, drones, missiles and artillery.
- In an apparent violation of the ceasefire agreement between Israel and Hezbollah, more Israeli strikes have been reported in Lebanon. Moreover, Israeli strikes continued across Gaza amid renewed ceasefire talks.
Gold price technical setup supports prospects for the emergence of some dip-buying at lower levels
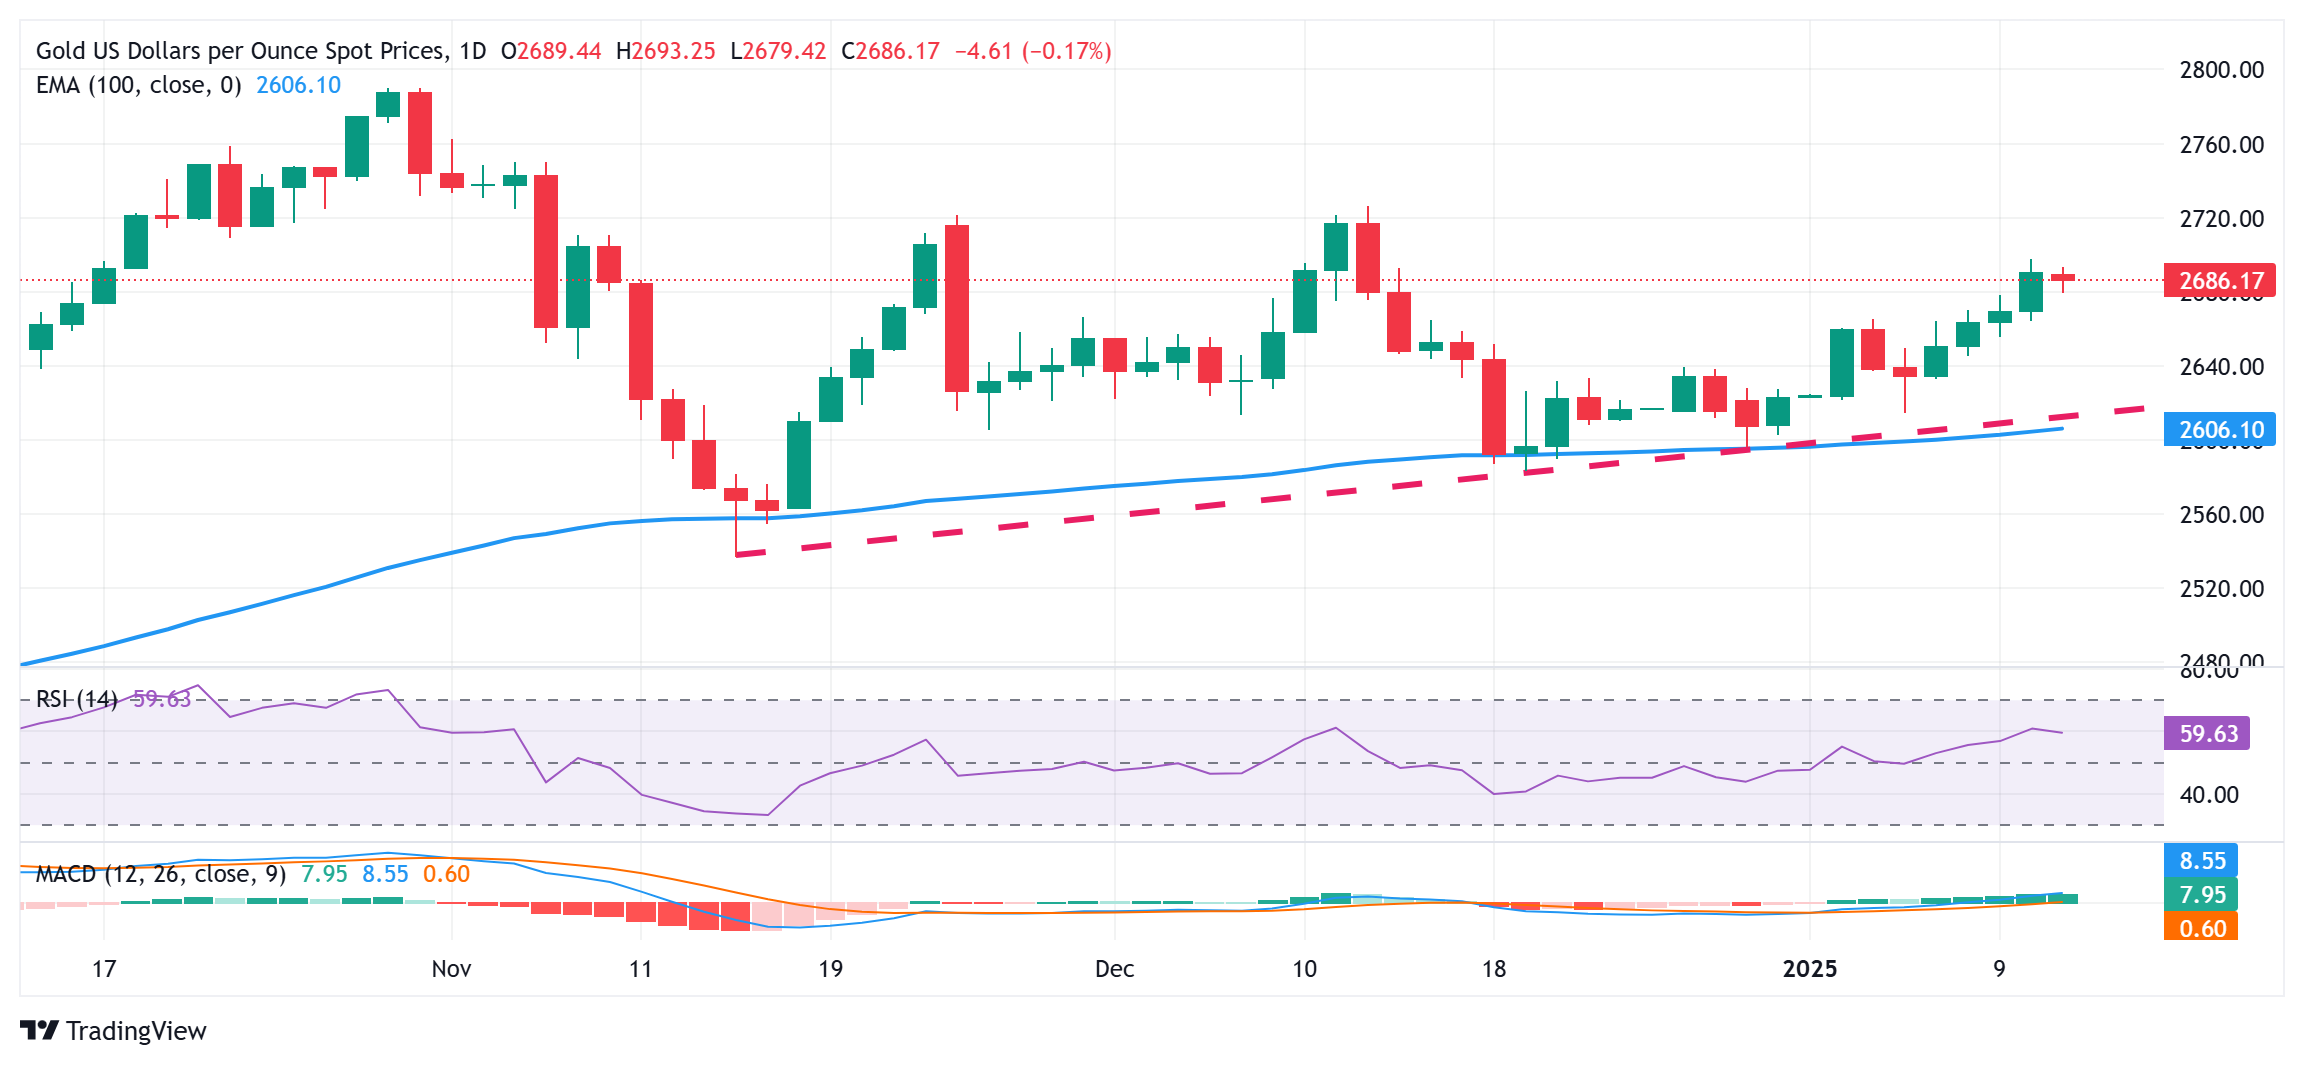
From a technical perspective, any further slide is likely to attract fresh buyers and find decent support near the $2,665-2,664 area. A convincing break below, however, could make the Gold price vulnerable to accelerate the downfall towards the $2,635 region. The downward trajectory could extend further towards the $2,605 confluence, comprising the 100-day Exponential Moving Average (SMA) and a multi-week-old ascending trend-line support.
On the flip side, bulls might now wait for a sustained strength beyond the $2,700 mark before placing fresh bets. Given that oscillators on the daily chart have been gaining positive traction and are still far from being in the overbought territory, the Gold price might then climb to the $2,715 region en route to the $2,730-2,732 area and the $2,746-2,748 supply zone.
Gold FAQs
Gold has played a key role in human’s history as it has been widely used as a store of value and medium of exchange. Currently, apart from its shine and usage for jewelry, the precious metal is widely seen as a safe-haven asset, meaning that it is considered a good investment during turbulent times. Gold is also widely seen as a hedge against inflation and against depreciating currencies as it doesn’t rely on any specific issuer or government.
Central banks are the biggest Gold holders. In their aim to support their currencies in turbulent times, central banks tend to diversify their reserves and buy Gold to improve the perceived strength of the economy and the currency. High Gold reserves can be a source of trust for a country’s solvency. Central banks added 1,136 tonnes of Gold worth around $70 billion to their reserves in 2022, according to data from the World Gold Council. This is the highest yearly purchase since records began. Central banks from emerging economies such as China, India and Turkey are quickly increasing their Gold reserves.
Gold has an inverse correlation with the US Dollar and US Treasuries, which are both major reserve and safe-haven assets. When the Dollar depreciates, Gold tends to rise, enabling investors and central banks to diversify their assets in turbulent times. Gold is also inversely correlated with risk assets. A rally in the stock market tends to weaken Gold price, while sell-offs in riskier markets tend to favor the precious metal.
The price can move due to a wide range of factors. Geopolitical instability or fears of a deep recession can quickly make Gold price escalate due to its safe-haven status. As a yield-less asset, Gold tends to rise with lower interest rates, while higher cost of money usually weighs down on the yellow metal. Still, most moves depend on how the US Dollar (USD) behaves as the asset is priced in dollars (XAU/USD). A strong Dollar tends to keep the price of Gold controlled, whereas a weaker Dollar is likely to push Gold prices up.
Artigos Recomendados


