

Gold price remains close to multi-week trough amid bullish US Dollar
- Gold price drifts lower for the second straight day and is pressured by a combination of factors.
- The Trump trade optimism continues to underpin the USD and weighs on the precious metal.
- A positive risk tone also undermines the safe-haven XAU/USD despite more Fed rate cut bets.
Gold price (XAU/USD) adds to last week's heavy losses and remains under some selling pressure for the second successive day on Monday. The US Dollar (USD) holds steady below a four-month peak touched last week in the wake of optimism over Donald Trump's anticipated expansionary policies and turns out to be a key factor undermining the commodity. Furthermore, President-elect Trump has vowed to cut corporate taxes, which remains supportive of the risk-on mood and contributes to driving flows away from the safe-haven precious metal.
Meanwhile, expectations that Trump's policies could spur economic growth and inflation and restrict the Federal Reserve's (Fed) ability to cut interest rates more aggressively keep the US Treasury bond yields elevated. This, in turn, exerts additional pressure on the non-yielding Gold price, though bets for further Fed rate cuts could offer some support. Traders might also opt to move to the sidelines ahead of this week's release of the latest US consumer inflation figures and speeches by influential FOMC members, including Fed Chair Jerome Powell on Friday.
Gold price continues to be weighed down by the Trump trade optimism and the risk-on mood
- Gold price registered its steepest weekly decline in over five months in the wake of a broad-based US Dollar rally and a sharp rise in the US Treasury bond yields following Donald Trump's victory in the US presidential election.
- The so-called Trump trade euphoria continues to act as a tailwind for the Greenback and exerts some downward pressure on the Gold price for the second successive day on Monday amid the upbeat mood around the equity markets.
- The Federal Reserve last week lowered its benchmark overnight borrowing rate by 25 basis points and signaled plans to ease monetary policy further, with traders still pricing in a 65% chance of another interest rate cut in December.
- Minneapolis Fed President Neel Kashkari said that the central bank wants to have confidence and needs to see more evidence that inflation will go all the way back to the 2% target before deciding on further interest rate cuts.
- President-elect Trump’s protectionist push is expected to exacerbate global trade tensions and trigger a worldwide trend of restrictive trade practices, which could strain global markets and offer support to the safe-haven XAU/USD.
- Investors might also refrain from placing aggressive directional bets ahead of this week's release of the US consumer inflation figures on Wednesday, the US Producer Price Index on Thursday and US Retail Sales figures on Friday.
- Apart from this, investors will closely scrutinize comments from a slew of Fed officials, including Fed Chair Jerome Powell, for more signals about the rate-cut path, which will drive the USD and provide a fresh impetus to the commodity.
Technical Outlook: Gold price could find support near 50-day SMA, around $2,647-2,646 area
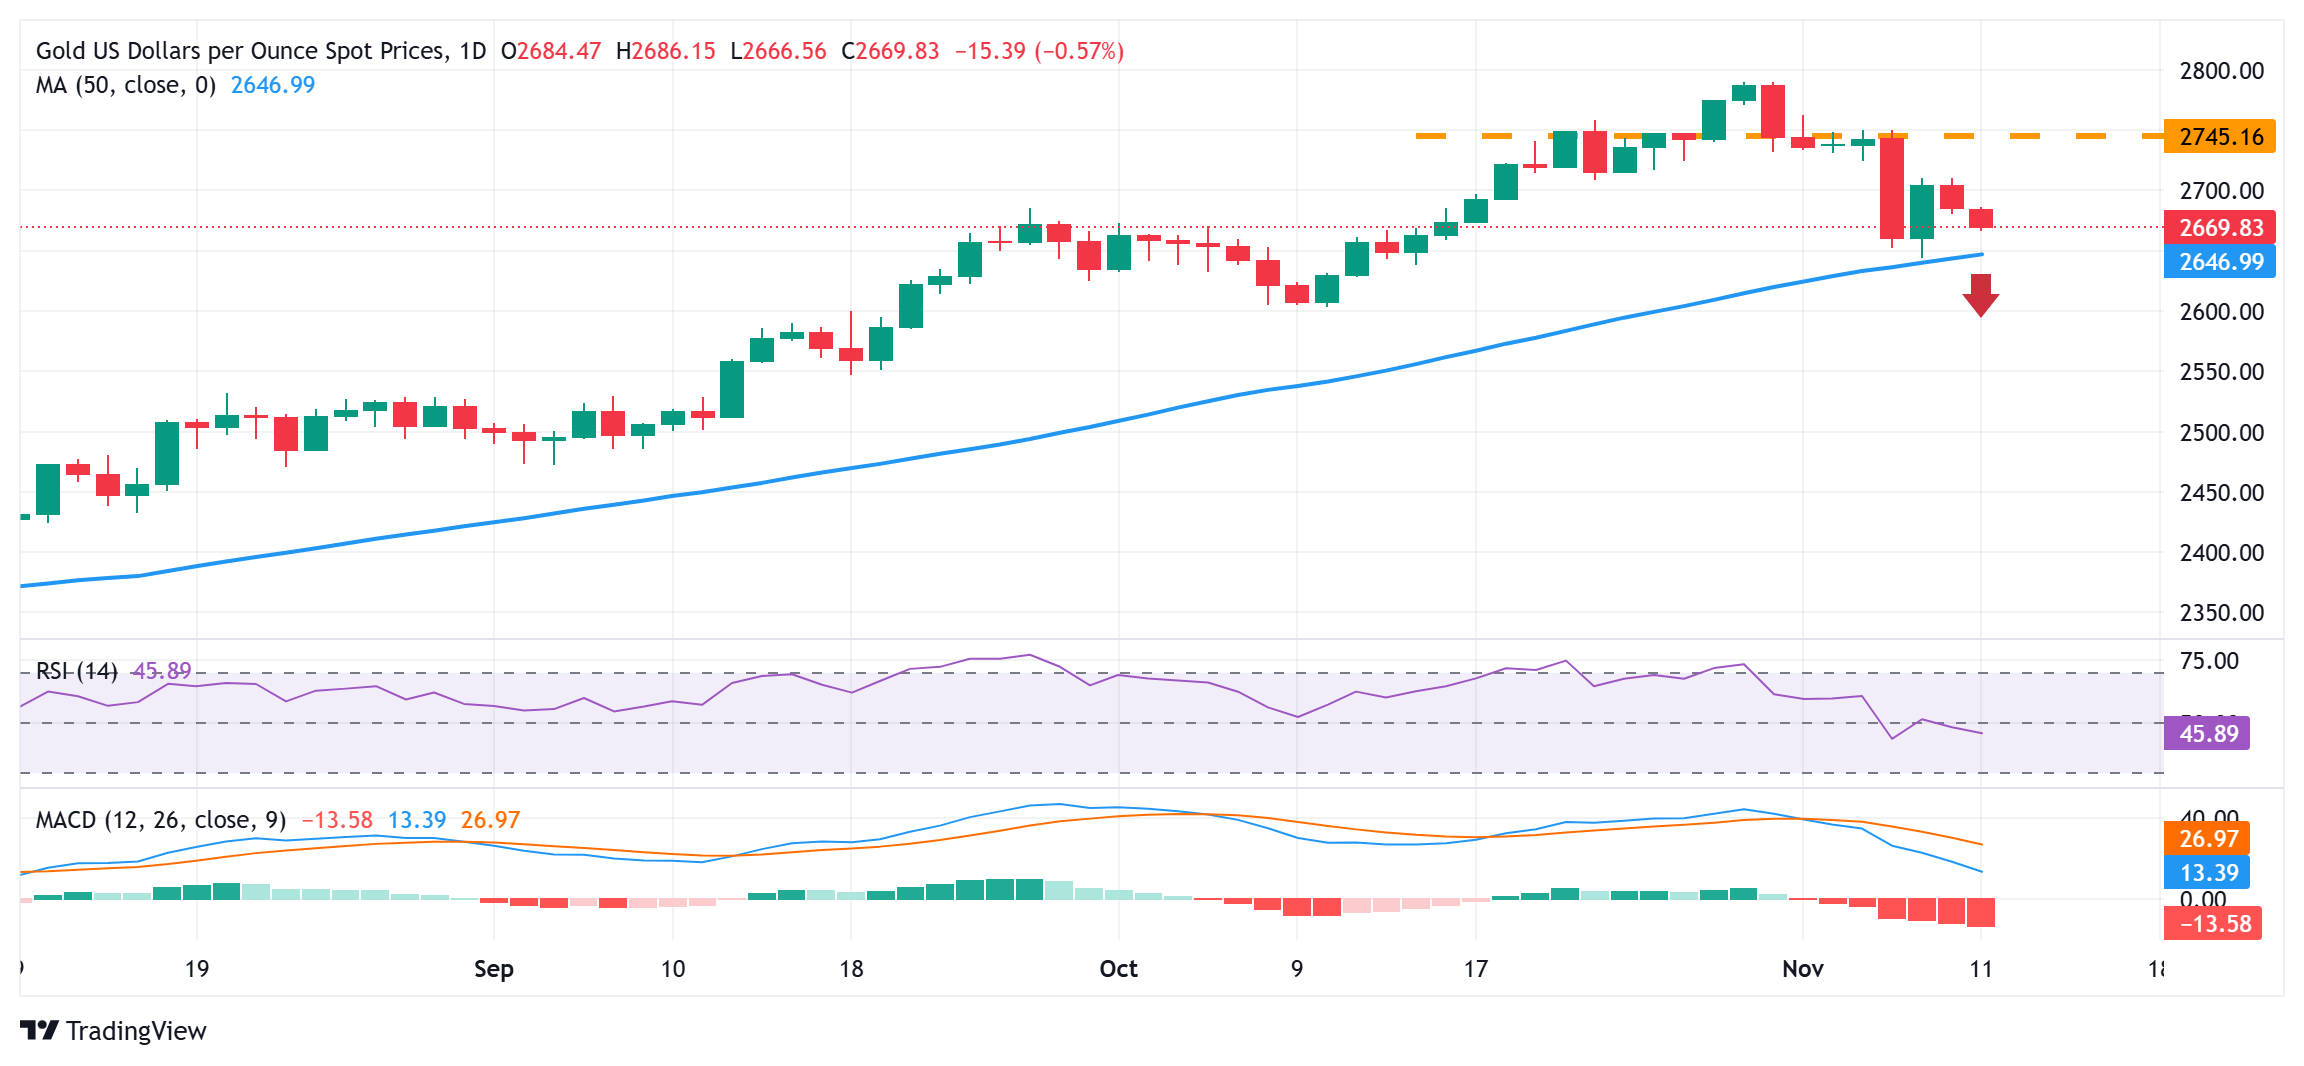
From a technical perspective, any further decline is likely to find some support near the $2,660 zone ahead of the 50-day Simple Moving Average (SMA), currently pegged near the $2,647-2,746 region. Some follow-through selling below last week's swing low, around the $2,643 area, will be seen as a fresh trigger for bearish traders. Given that oscillators on the daily chart have been losing positive traction, the Gold price might then accelerate the fall toward the October monthly swing low, around the $2,605-2,602 region.
On the flip side, momentum back above the $2,700 mark now seems to confront stiff resistance near the $2,718 region ahead of the $2,740-2,745 supply zone. A sustained strength beyond the latter will suggest that the corrective pullback has run its course and lift the Gold price beyond the $2,750 static resistance, towards the $2,758-2,790 zone, or the record high touched on October 31.
Gold FAQs
Gold has played a key role in human’s history as it has been widely used as a store of value and medium of exchange. Currently, apart from its shine and usage for jewelry, the precious metal is widely seen as a safe-haven asset, meaning that it is considered a good investment during turbulent times. Gold is also widely seen as a hedge against inflation and against depreciating currencies as it doesn’t rely on any specific issuer or government.
Central banks are the biggest Gold holders. In their aim to support their currencies in turbulent times, central banks tend to diversify their reserves and buy Gold to improve the perceived strength of the economy and the currency. High Gold reserves can be a source of trust for a country’s solvency. Central banks added 1,136 tonnes of Gold worth around $70 billion to their reserves in 2022, according to data from the World Gold Council. This is the highest yearly purchase since records began. Central banks from emerging economies such as China, India and Turkey are quickly increasing their Gold reserves.
Gold has an inverse correlation with the US Dollar and US Treasuries, which are both major reserve and safe-haven assets. When the Dollar depreciates, Gold tends to rise, enabling investors and central banks to diversify their assets in turbulent times. Gold is also inversely correlated with risk assets. A rally in the stock market tends to weaken Gold price, while sell-offs in riskier markets tend to favor the precious metal.
The price can move due to a wide range of factors. Geopolitical instability or fears of a deep recession can quickly make Gold price escalate due to its safe-haven status. As a yield-less asset, Gold tends to rise with lower interest rates, while higher cost of money usually weighs down on the yellow metal. Still, most moves depend on how the US Dollar (USD) behaves as the asset is priced in dollars (XAU/USD). A strong Dollar tends to keep the price of Gold controlled, whereas a weaker Dollar is likely to push Gold prices up.
Artigos Recomendados


