


Australian Dollar inches higher as China’s GDP rises in second quarter
- The Australian Dollar advances following the release of key economic data from China.
- China’s Q2 GDP rose 5.2% YoY, against the expected increase of 5.1%.
- Trump has warned to impose “very severe” tariffs on Russia if no peace deal is made within 50 days.
The Australian Dollar (AUD) gains ground against the US Dollar (USD) on Tuesday, following China’s economic data. In Australia’s close trading partner, China, the economy expanded at an annual rate of 5.2% in the second quarter, compared to a 5.4% growth in the first quarter and the expected 5.1% growth. Meanwhile, the Chinese Gross Domestic Product (GDP) rate rose 1.1% in Q2, against the market consensus of a 0.9% increase. Moreover, Retail Sales increased by 4.8% YoY in June, against the 5.6% expected and 6.4% prior, while Industrial Production came in at 6.8%, against the 5.6% expected.
The AUD/USD pair may face challenges as the US Dollar may regain its ground amid renewed geopolitical concerns. US President Donald Trump has threatened to impose “very severe” tariffs on Russia if no peace deal is reached within 50 days. Trump also warned of secondary tariffs on countries importing Russian Oil. Traders await China’s Q2 Gross Domestic Product (GDP), Industrial Production, and Retail Sales data later in the day.
Australia’s Westpac Consumer Confidence climbed 0.6% month-over-month in July, following a 0.5% gain in June. Although the mood lifted slightly, the latest outcome underscored clear disappointment after the Reserve Bank of Australia (RBA) unexpectedly kept rates unchanged at its July meeting.
The RBA may maintain the interest rates at its next August meeting to get inflation on track to sustainably return to the 2-1/2% target. RBA Governor Michele Bullock stated that inflation risks persist, citing the elevated unit labor costs and weak productivity as factors that could drive inflation above current projections. Meanwhile, RBA Deputy Governor Andrew Hauser highlighted growing global economic uncertainty and warned that the impact of tariffs on the world economy could be significant.
Australian Dollar edges higher as US Dollar holds losses ahead of CPI data
- The US Dollar Index (DXY), which measures the value of the US Dollar against six major currencies, is holding losses at around 98.10 at the time of writing. Investors are likely awaiting June's Consumer Price Index (CPI) data on Tuesday to gain fresh impetus over the Federal Reserve’s (Fed) monetary outlook.
- President Trump, alongside NATO Secretary-General Mark Rutte, confirmed that European allies will purchase billions of dollars’ worth of American-made weapons, such as Patriot missile systems. These weapons will be transferred to Ukraine in the coming weeks to tackle intensified Russian attacks.
- The US government immediately imposed on Monday a 17% duty on most imports of fresh tomatoes from Mexico after negotiations ended without an agreement to avert the tariff. Trump announced, on Saturday, a 30% tariff on imports from the European Union (EU) and Mexico starting August 1. He also proposed a blanket tariff rate of 15%-20% on other trading partners, an increase from the current 10% baseline rate. In response, the European Union announced on Sunday that it will extend its pause on retaliatory measures against US tariffs until early August, in hopes of reaching a negotiated agreement.
- Chicago Fed President Austan Goolsbee stated that ongoing trade policy at the hands of Trump's constant tariff threats could hamper the ability of the Fed to deliver rate reductions that both the broader market and Trump himself want to see.
- The US government posted a $27 billion budget surplus in June, fueled by a surge in customs duties revenue, which reached a record $27.2 billion. This jump in tariff collections, largely stemming from policies introduced during the Trump administration, contributed to a 13% increase in total budget receipts, which rose to $526 billion. Meanwhile, federal spending declined by 7% to $499 billion.
- The Federal Open Market Committee (FOMC) Minutes from the June 17–18 meeting, released last week, indicated that policymakers largely maintained a wait-and-see stance regarding future interest rate decisions.
- China's Trade Balance arrived at CNY585.96 billion for June, narrowing from the previous figure of CNY743.56 billion. Chinese Exports climbed 7.2% year-over-year in June, following 6.3% in April. Meanwhile, imports increased 2.3% YoY in the same period, recovering from a previous decline of 2.1%.
- A Chinese customs spokesperson said that China’s Exports will continue to forge ahead in the next stage despite challenges. It is important to note that Chinese economic data could impact the AUD, as China is a major trading partner of Australia.
- The Reuters survey poll showed that 30 analysts forecasted the Reserve Bank of Australia to cut the cash rate by 25 basis points to 3.60% in August. Australia’s four major banks, ANZ, CBA, NAB, and Westpac, also support the rate cut.
- Australian Treasurer Jim Chalmers said that the Reserve Bank of Australia’s decision to hold rates was neither the outcome millions of Australians had hoped for nor what markets had anticipated. Chalmers added that the central bank has signaled a clear direction on inflation and interest rates moving forward.
Australian Dollar hovers around nine-day EMA near 0.6550
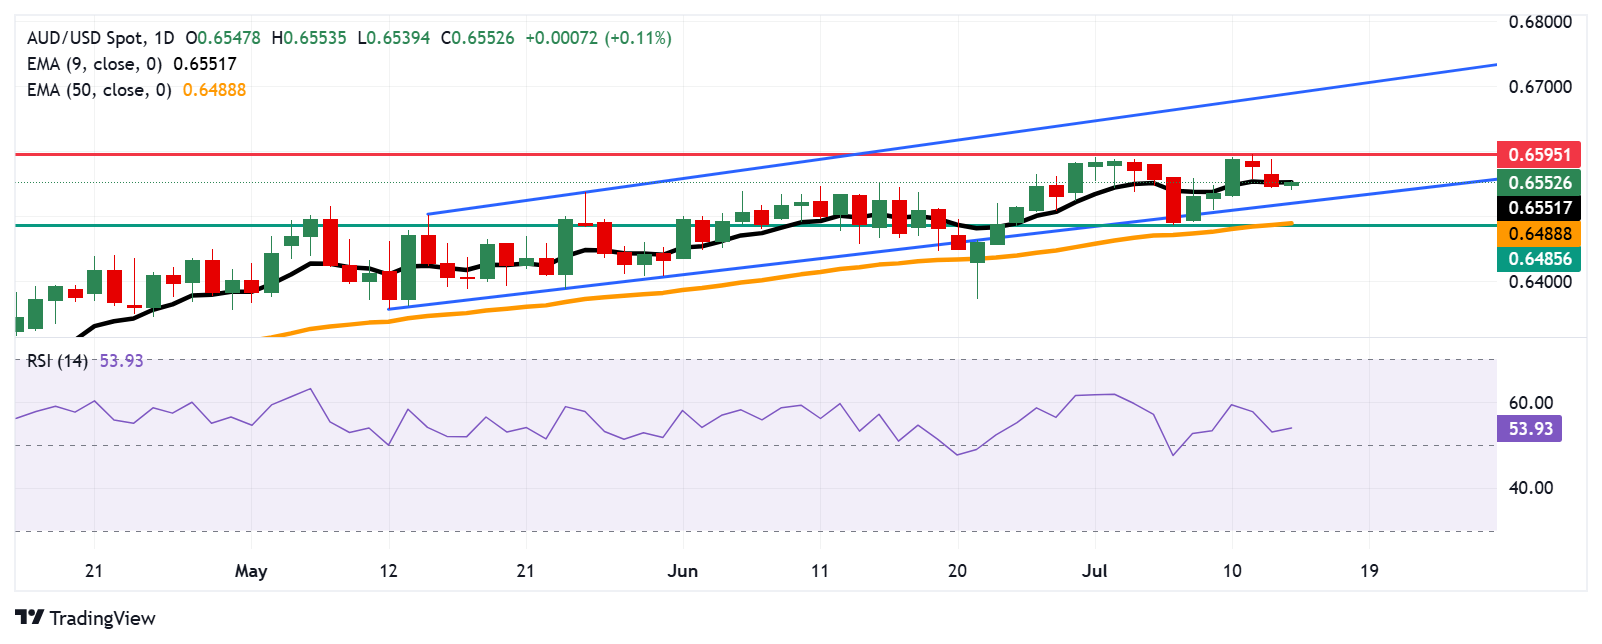
The AUD/USD pair is trading around 0.6555 on Tuesday. The daily chart’s technical analysis indicated a persistent bullish sentiment as the pair is positioned within the ascending channel pattern. The 14-day Relative Strength Index (RSI) remains slightly above the 50 mark, strengthening the bullish bias. However, the pair is hovering around the nine-day Exponential Moving Average (EMA), indicating that short-term price momentum is neutral.
On the upside, the AUD/USD pair could approach the eight-month high of 0.6595, which was reached on July 11. A break above this level could strengthen the bullish bias and support the pair to explore the region around the upper boundary of the ascending channel around 0.6690.
The AUD/USD pair is testing its immediate support at the nine-day EMA of 0.6551, followed by the ascending channel’s lower boundary around 0.6520. A break below this channel would weaken the short-term price momentum and put downward pressure on the pair to navigate the area around the 50-day EMA at 0.6488, aligned with the three-week low at 0.6485.
AUD/USD: Daily Chart
Australian Dollar PRICE Today
The table below shows the percentage change of Australian Dollar (AUD) against listed major currencies today. Australian Dollar was the strongest against the British Pound.
| USD | EUR | GBP | JPY | CAD | AUD | NZD | CHF | |
|---|---|---|---|---|---|---|---|---|
| USD | -0.03% | 0.02% | -0.01% | -0.02% | 0.06% | 0.00% | -0.18% | |
| EUR | 0.03% | -0.02% | -0.02% | -0.01% | 0.05% | -0.02% | -0.14% | |
| GBP | -0.02% | 0.02% | 0.00% | 0.00% | 0.04% | -0.03% | 0.02% | |
| JPY | 0.01% | 0.02% | 0.00% | -0.03% | 0.09% | -0.03% | -0.08% | |
| CAD | 0.02% | 0.01% | -0.00% | 0.03% | 0.10% | -0.06% | 0.02% | |
| AUD | -0.06% | -0.05% | -0.04% | -0.09% | -0.10% | -0.09% | -0.07% | |
| NZD | -0.01% | 0.02% | 0.03% | 0.03% | 0.06% | 0.09% | 0.06% | |
| CHF | 0.18% | 0.14% | -0.02% | 0.08% | -0.02% | 0.07% | -0.06% |
The heat map shows percentage changes of major currencies against each other. The base currency is picked from the left column, while the quote currency is picked from the top row. For example, if you pick the Australian Dollar from the left column and move along the horizontal line to the US Dollar, the percentage change displayed in the box will represent AUD (base)/USD (quote).
Economic Indicator
Gross Domestic Product (YoY)
The Gross Domestic Product (GDP), released by the National Bureau of Statistics of China on a monthly basis, is a measure of the total value of all goods and services produced in China during a given period. The GDP is considered as the main measure of China’s economic activity. The YoY reading compares economic activity in the reference quarter compared with the same quarter a year earlier. Generally speaking, a rise in this indicator is bullish for the Renminbi (CNY), while a low reading is seen as bearish.
Read more.Last release: Tue Jul 15, 2025 02:00
Frequency: Quarterly
Actual: 5.2%
Consensus: 5.1%
Previous: 5.4%
Source:
Artigos Recomendados


