


Australian Dollar holds losses following labor data, eyes on Middle East
- The Australian Dollar remains subdued after mixed employment figures were released on Thursday.
- Australia’s Employment Change surprisingly declined by 2.5K in May, while Unemployment Rate steadied at 4.1% as expected.
- The Federal Reserve kept its interest rates on hold at 4.5% in June, as expected.
The Australian Dollar (AUD) depreciated against the US Dollar (USD) on Thursday, retracing its recent gains registered in the previous session. The AUD/USD pair holds losses following the employment data release from Australia. The risk-sensitive pair also struggles due to dampened risk sentiment amid escalating Middle East tensions.
Australia’s Employment Change fell by 2.5K in May against a 87.6K increase in April (revised from 89K) and the consensus forecast of a 25K rise. Furthermore, the Unemployment Rate steadied at 4.1% in May, as expected.
Bloomberg cited unnamed sources on Thursday, reporting that “US officials prepare for possible Iran strike in coming days.” “The US plans for any Iran attack continue to evolve.” Moreover, the Wall Street Journal cited individuals familiar with discussions, saying that US President Trump said late Tuesday that he approved of attack plans for Iran, but held it to see if Tehran would abandon its nuclear program.
Australian Dollar declines as US Dollar appreciates amid increased risk aversion
- The US Dollar Index (DXY), which measures the value of the US Dollar against six major currencies, is trading higher at around 99.00 at the time of writing.
- The US Federal Reserve (Fed) decided to keep interest rates steady at 4.5% in June as widely expected. The Federal Open Market Committee (FOMC) still sees around 50 basis points of interest rate cuts through the end of 2025.
- Fed Chair Jerome Powell warned that ongoing policy uncertainty will keep the Fed in a rate-hold stance, and any rate cuts will be contingent on further improvement in labor and inflation data.
- US Retail Sales fell by 0.9% in May, worse than the expected 0.7% decline and April’s 0.1% decrease (revised from +0.1%).
- On Tuesday, US President Donald Trump posted on his social media platform, calling for Iran’s “unconditional surrender.” Investors are concerned that the United States will participate in the Israel-Iran conflict.
- G7 leaders issued a joint statement on Monday: “We have been consistently clear that Iran can never have a nuclear weapon.” The leaders emphasized that resolving the Iranian crisis could lead to broader de-escalation of hostilities in the region.
- China Retail Sales rose 6.4% year-over-year in May, surpassing the 5.0% expected and April’s 5.1% increase. Meanwhile, Industrial Production increased 5.8% YoY, but came in below the 5.9% forecast and 6.1% prior.
- Moreover, the National Bureau of Statistics (NBS) in China noted that the domestic economy is expected to have remained generally stable for the first half (H1) of 2025. However, economic growth in China may struggle since the second quarter due to uncertain trade policies.
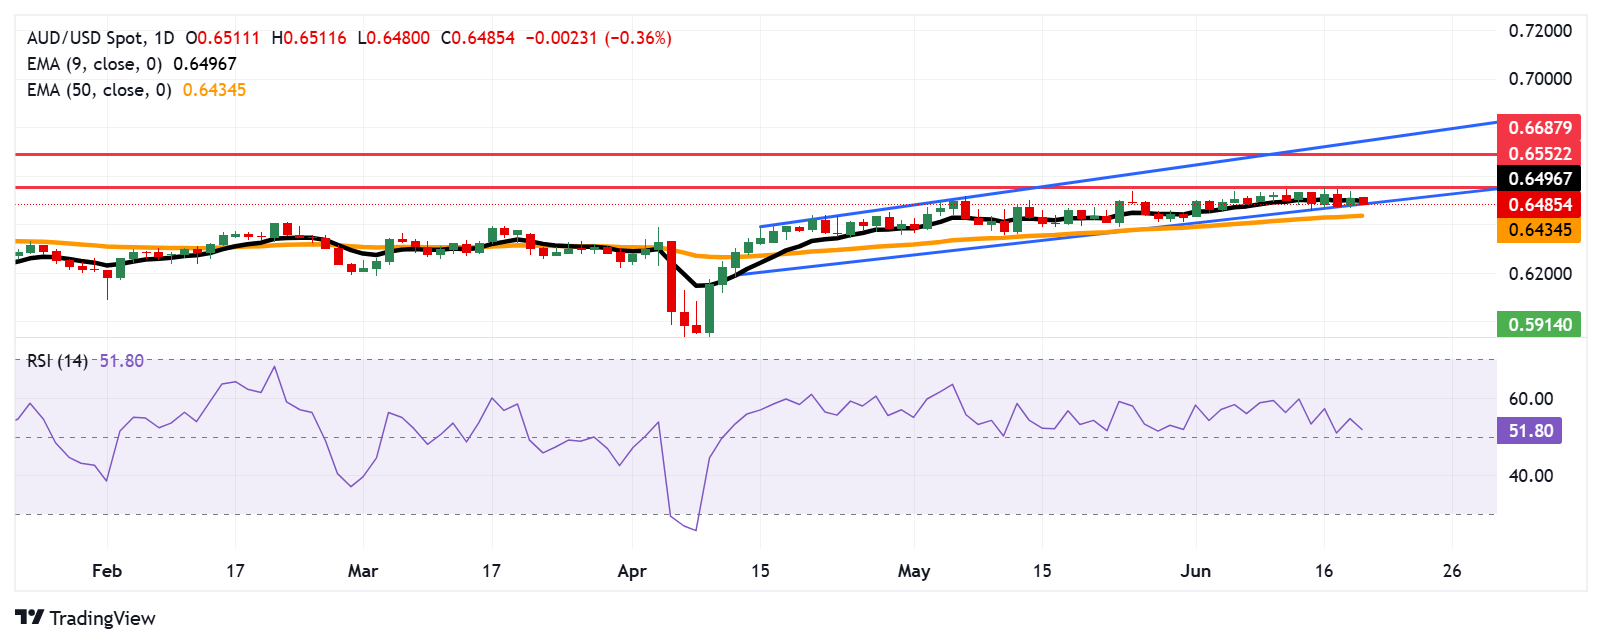
Australian Dollar remains below 0.6500, tests ascending channel’s lower boundary
AUD/USD is trading around 0.6490 on Thursday, with a prevailing bullish bias as the daily chart’s technical analysis indicates that the pair remains within the ascending channel. The 14-day Relative Strength Index (RSI) is positioned slightly above the 50 mark, suggesting a persistent bullish bias. However, the pair remains below the nine-day Exponential Moving Average (EMA), indicating that short-term price momentum is weakening.
The immediate barrier appears at the nine-day EMA of 0.6496, followed by the seven-month high of 0.6552, which was recorded on June 16. A break above this level could support the pair to target the eight-month high at 0.6687, followed by the upper boundary of the ascending channel around 0.6740.
On the downside, the AUD/USD pair is testing the ascending channel’s lower boundary around 0.6480. A break below the channel would weaken the bullish bias and prompt the pair to test the 50-day EMA at 0.6434.
AUD/USD: Daily Chart
Australian Dollar PRICE Today
The table below shows the percentage change of Australian Dollar (AUD) against listed major currencies today. Australian Dollar was the weakest against the US Dollar.
| USD | EUR | GBP | JPY | CAD | AUD | NZD | CHF | |
|---|---|---|---|---|---|---|---|---|
| USD | 0.21% | 0.20% | -0.06% | 0.18% | 0.41% | 0.55% | 0.07% | |
| EUR | -0.21% | -0.00% | -0.30% | -0.09% | 0.14% | 0.30% | -0.18% | |
| GBP | -0.20% | 0.00% | -0.29% | -0.08% | 0.14% | 0.39% | 0.00% | |
| JPY | 0.06% | 0.30% | 0.29% | 0.19% | 0.33% | 0.53% | 0.19% | |
| CAD | -0.18% | 0.09% | 0.08% | -0.19% | 0.14% | 0.39% | 0.09% | |
| AUD | -0.41% | -0.14% | -0.14% | -0.33% | -0.14% | 0.30% | -0.21% | |
| NZD | -0.55% | -0.30% | -0.39% | -0.53% | -0.39% | -0.30% | -0.43% | |
| CHF | -0.07% | 0.18% | -0.01% | -0.19% | -0.09% | 0.21% | 0.43% |
The heat map shows percentage changes of major currencies against each other. The base currency is picked from the left column, while the quote currency is picked from the top row. For example, if you pick the Australian Dollar from the left column and move along the horizontal line to the US Dollar, the percentage change displayed in the box will represent AUD (base)/USD (quote).
Economic Indicator
Employment Change s.a.
The Employment Change released by the Australian Bureau of Statistics is a measure of the change in the number of employed people in Australia. The statistic is adjusted to remove the influence of seasonal trends. Generally speaking, a rise in Employment Change has positive implications for consumer spending, stimulates economic growth, and is bullish for the Australian Dollar (AUD). A low reading, on the other hand, is seen as bearish.
Read more.Last release: Thu Jun 19, 2025 01:30
Frequency: Monthly
Actual: -2.5K
Consensus: 25K
Previous: 89K
Source: Australian Bureau of Statistics
Artigos Recomendados


