
Australian Dollar remains stronger following Q1 GDP data
- The Australian Dollar maintains its position after the release of mixed economic data on Wednesday.
- Australia’s Gross Domestic Product expanded 0.2% QoQ in Q1, against the previous 0.6% growth.
- The US Dollar faces challenges as tariff uncertainty may hurt growth in the US economy.
The Australian Dollar (AUD) appreciates against the US Dollar (USD) on Wednesday after registering over 0.5% losses in the previous session. The AUD/USD pair remains in positive territory following the release of mixed economic data from Australia.
Australian Bureau of Statistics (ABS) showed that Gross Domestic Product (GDP) grew by 0.2% quarter-over-quarter in the Q1, declining from the previous 0.6% growth. Australia’s economy fell short of the expected 0.4% rise. Meanwhile, the annual GDP growth rate remained consistent at 1.3%, against the expected 1.5%.
Moreover, the S&P Global Australia Composite Purchasing Managers’ Index (PMI) fell to 50.5 in May from April’s 51.0 reading, expanding for the eighth successive month. However, the pace indicates marginal growth in business activity, albeit the slowest so far in 2025.
The S&P Global Australia Services PMI came at 50.6 in May, marking a 16th straight month of expansion but at the slowest pace in six months. The Ai Group Manufacturing PMI posted a -23.5 reading, improved slightly from the previous -26.5. Manufacturers experience delays in major projects and rising market hesitation due to global and domestic uncertainty.
Reserve Bank of Australia (RBA) Assistant Governor Sarah Hunter expressed caution on Tuesday that “higher US tariffs will put a drag on the global economy.” Hunter noted that higher uncertainty could dampen investment, output, and employment in Australia. However, she also added that Australia’s exporters are relatively well-placed to weather the storm and assumes that Chinese authorities will support their economy through fiscal stimulus.
Australian Dollar advances as US Dollar edges lower amid growing tariff uncertainty
- The US Dollar Index (DXY), which measures the value of the US Dollar against six major currencies, is trading lower at around 99.10 at the time of writing. The Greenback struggles as traders adopt caution amid rising tariff uncertainty and its potential to hurt growth in the US economy.
- Job Openings and Labor Turnover Survey (JOLTS) showed the number of job openings on the last business day of April stood at 7.39 million, increasing from March’s 7.2 million openings. This figure surprisingly came in above the market expectation of 7.1 million.
- Institute for Supply Management (ISM) Manufacturing Purchasing Managers’ Index eased to 48.5 in May from 48.7 in April. This figure came in weaker than the expectation of 49.5.
- US President Donald Trump said at a rally in Pennsylvania on Friday that he planned to double import tariffs on steel and aluminum to build up pressure on global steel producers and intensify the trade war. "We are going to be imposing a 25% increase. We're going to bring it from 25% to 50% - the tariffs on steel into the United States of America, which will even further secure the steel industry in the United States," he said, per Reuters.
- The US Court of Appeals for the Federal Circuit in Washington, on Thursday, temporarily put a hold on a federal court ruling and allowed President Trump's tariffs to take effect. On Wednesday, a three-judge panel at the Court of International Trade in Manhattan halted Trump from imposing "Liberation Day" tariffs from taking effect. The federal court found that Trump exceeded his authority in imposing broad import tariffs and declared the executive orders issued on April 2 unlawful.
- House Republicans passed Trump’s “Big Beautiful Bill,” a multitrillion-dollar tax and spending package, which could increase the US fiscal deficit, along with the risk of bond yields staying higher for longer. This scenario raises concerns over the US economy and prompts traders to sell American assets under the “Sell America” trend. Policy experts anticipate Senate changes as GOP lawmakers aim to finalize the “big bill” by July 4.
- On Friday, Trump accused China of breaching a truce on tariffs reached earlier this month. Washington and Beijing agreed to temporarily lower reciprocal tariffs in a meeting in Geneva. Trump said that China had "totally violated its agreement with us". US Trade Representative Jamieson Greer also said that China had failed to remove non-tariff barriers as agreed.
- In response, a spokesperson from China’s Ministry of Commerce said on Monday that China had complied with the agreement by cancelling or suspending relevant tariff and non-tariff measures aimed at US "reciprocal tariffs."
- China's Caixin Manufacturing Purchasing Managers' Index (PMI) unexpectedly fell to 48.3 in May from 50.4 in April, falling short of the market expectations of a 50.6 expansion. However, the weekend data showed that the National Bureau of Statistics (NBS) Manufacturing PMI rose to 49.5 in May, from April’s 49.0 reading. Meanwhile, the Non-Manufacturing PMI declined to 50.3 from the previous 50.4 figure, falling short of the expected reading of 50.6. The Aussie Dollar could be impacted by Chinese economic data as both countries are close trading partners.
- RBA Minutes of its May monetary policy meeting suggested that the board viewed the case for a 25 basis point cut as a stronger one, preferring a policy to be cautious and predictable. The policymakers highlighted that US trade policy posed a significant and adverse impact on the global outlook, but had not yet affected the Australian economy, however, they did not persuade that a 50 bps was needed.
- The Reserve Bank of Australia (RBA) is expected to deliver more rate cuts in the upcoming policy meetings. The central bank acknowledged progress in curbing inflation and warned that US-China trade barriers pose downside risks to economic growth. Governor Michele Bullock stated that the RBA is prepared to take additional action if the economic outlook deteriorates sharply, raising the prospect of future rate cuts.
Australian Dollar finds immediate support at nine-day EMA near 0.6450
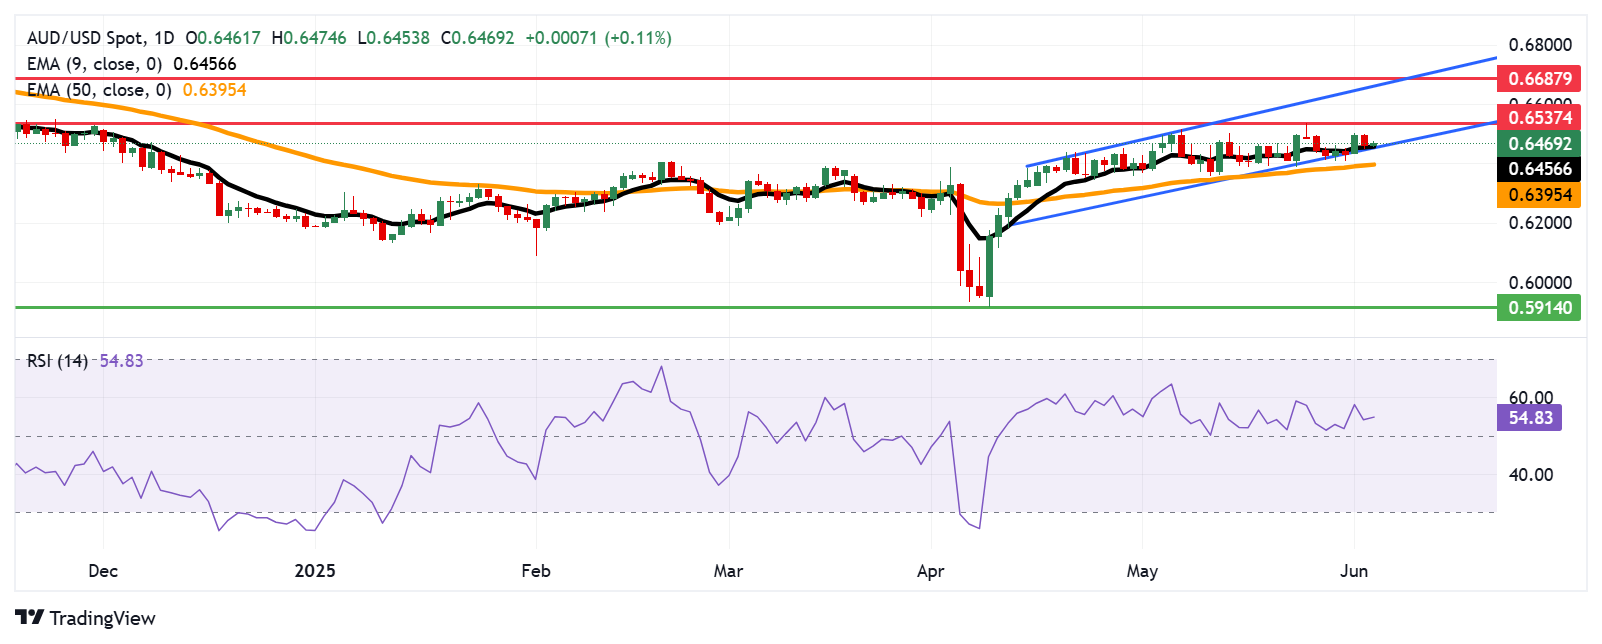
AUD/USD is trading around 0.6470 on Wednesday, indicating a prevailing bullish bias. The daily chart’s technical analysis suggests that the pair remains within the ascending channel pattern. The short-term price momentum remains stronger as the pair stays above the nine-day Exponential Moving Average (EMA). Additionally, the 14-day Relative Strength Index (RSI) is positioned above the 50 mark, indicating a persistent bullish outlook.
On the upside, the AUD/USD pair could approach 0.6537, a seven-month high recorded on May 26. A break above this initial barrier could support the pair to explore the region around the upper boundary of the ascending channel around 0.6670.
The immediate support appears at the nine-day EMA of 0.6456, aligned with the ascending channel’s lower boundary around 0.6450. A successful breach below this crucial support zone could dampen the bullish bias and lead the AUD/USD pair to test the 50-day EMA at 0.6395.
AUD/USD: Daily Chart
Australian Dollar PRICE Today
The table below shows the percentage change of Australian Dollar (AUD) against listed major currencies today. Australian Dollar was the strongest against the US Dollar.
| USD | EUR | GBP | JPY | CAD | AUD | NZD | CHF | |
|---|---|---|---|---|---|---|---|---|
| USD | -0.16% | -0.15% | -0.11% | -0.09% | -0.14% | -0.13% | -0.14% | |
| EUR | 0.16% | -0.01% | 0.03% | 0.07% | 0.02% | 0.02% | 0.00% | |
| GBP | 0.15% | 0.01% | 0.00% | 0.07% | 0.04% | 0.04% | 0.02% | |
| JPY | 0.11% | -0.03% | 0.00% | 0.06% | -0.06% | 0.05% | 0.02% | |
| CAD | 0.09% | -0.07% | -0.07% | -0.06% | -0.05% | -0.05% | -0.06% | |
| AUD | 0.14% | -0.02% | -0.04% | 0.06% | 0.05% | -0.00% | -0.02% | |
| NZD | 0.13% | -0.02% | -0.04% | -0.05% | 0.05% | 0.00% | -0.01% | |
| CHF | 0.14% | -0.01% | -0.02% | -0.02% | 0.06% | 0.02% | 0.01% |
The heat map shows percentage changes of major currencies against each other. The base currency is picked from the left column, while the quote currency is picked from the top row. For example, if you pick the Australian Dollar from the left column and move along the horizontal line to the US Dollar, the percentage change displayed in the box will represent AUD (base)/USD (quote).
Economic Indicator
Gross Domestic Product (QoQ)
The Gross Domestic Product (GDP), released by the Australian Bureau of Statistics on a quarterly basis, is a measure of the total value of all goods and services produced in Australia during a given period. The GDP is considered as the main measure of Australian economic activity. The QoQ reading compares economic activity in the reference quarter to the previous quarter. Generally, a rise in this indicator is bullish for the Australian Dollar (AUD), while a low reading is seen as bearish.
Read more.Last release: Wed Jun 04, 2025 01:30
Frequency: Quarterly
Actual: 0.2%
Consensus: 0.4%
Previous: 0.6%
Source: Australian Bureau of Statistics
The Australian Bureau of Statistics (ABS) releases the Gross Domestic Product (GDP) on a quarterly basis. It is published about 65 days after the quarter ends. The indicator is closely watched, as it paints an important picture for the economy. A strong labor market, rising wages and rising private capital expenditure data are critical for the country’s improved economic performance, which in turn impacts the Reserve Bank of Australia’s (RBA) monetary policy decision and the Australian dollar. Actual figures beating estimates is considered AUD bullish, as it could prompt the RBA to tighten its monetary policy.
Artigos Recomendados


