USD/JPY Price Forecast: Climbs above 147.00 as bulls target Kumo

Fonte Fxstreet
  • USD/JPY rises above 147 for the first time since September, driven by escalating Middle East tensions.
  • Bullish RSI signals further upside potential, with buyers eyeing resistance at 147.25, followed by 147.78 and 148.00.
  • A reversal could see USD/JPY testing support at the 50-DMA of 145.38, with further downside risk at 145.00 and 143.93.

The USD/JPY edges higher on Thursday, climbs above 147.00 for the first time since September, trades at 146.92 and gains 0.31% at the time of writing. The financial markets narrative hasn’t changed, as traders hear war drums beating, as the Middle East conflict escalates, triggering a flow to haven currencies, boosting the Greenback.

USD/JPY Price Forecast: Technical outlook

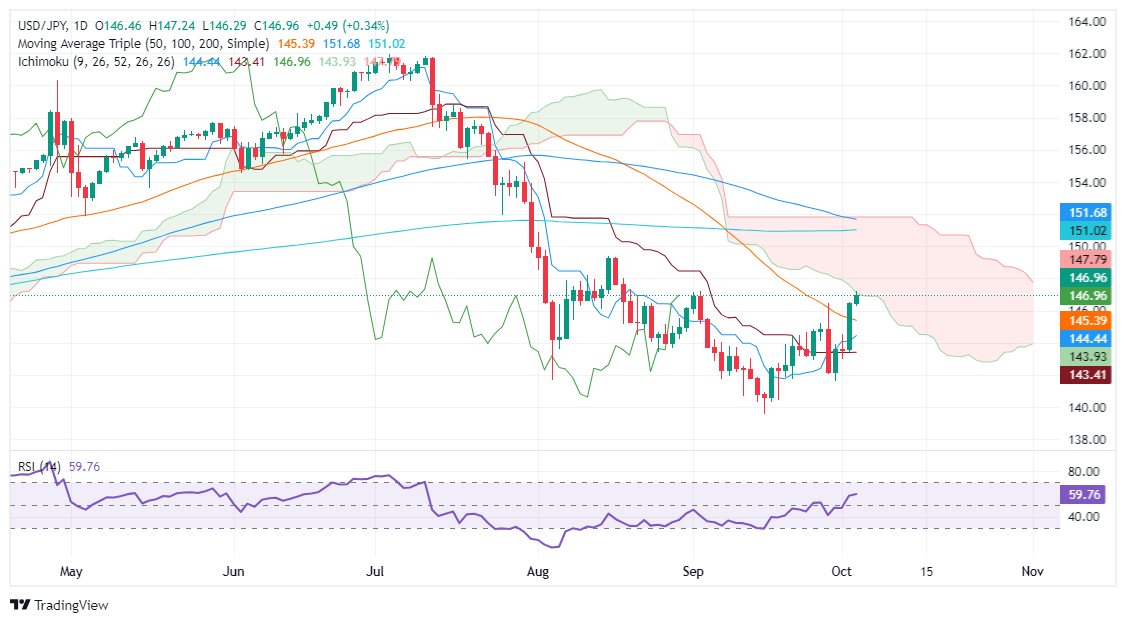
The USD/JPY daily chart is neutral to downward biased, as buyers tested the bottom of the Ichimoku Cloud (Kumo) at 147.25. Momentum hints that buyers remain in charge, and might push prices higher.

The Relative Strength Index (RSI) is bullish, aiming to the upside. This means, the USD/JPY is tilted to the upside, in the near-term.

The USD/JPY must clear the top of the Kumo at 147.25. In that outcome, the next resistance would be the Senkou Span B at 147.78, followed by 148.00. If those levels are cleared, the 200-day moving average (DMA) would be next at 151.02.

Conversely, if the pair reverses its course, the first support would be the 50-DMA at 145.38. Once surpassed, the next stop would be the 145.00 figure, followed by the Senkou Span A at 143.93.

USD/JPY Price Action – Daily Chart
Japanese Yen PRICE Today

The table below shows the percentage change of Japanese Yen (JPY) against listed major currencies today. Japanese Yen was the strongest against the British Pound.

  USD EUR GBP JPY CAD AUD NZD CHF
USD   0.14% 1.10% 0.34% 0.40% 0.65% 0.83% 0.37%
EUR -0.14%   0.97% 0.19% 0.24% 0.51% 0.67% 0.23%
GBP -1.10% -0.97%   -0.75% -0.72% -0.45% -0.29% -0.71%
JPY -0.34% -0.19% 0.75%   0.07% 0.31% 0.46% 0.03%
CAD -0.40% -0.24% 0.72% -0.07%   0.25% 0.43% -0.02%
AUD -0.65% -0.51% 0.45% -0.31% -0.25%   0.16% -0.26%
NZD -0.83% -0.67% 0.29% -0.46% -0.43% -0.16%   -0.43%
CHF -0.37% -0.23% 0.71% -0.03% 0.02% 0.26% 0.43%  

The heat map shows percentage changes of major currencies against each other. The base currency is picked from the left column, while the quote currency is picked from the top row. For example, if you pick the Japanese Yen from the left column and move along the horizontal line to the US Dollar, the percentage change displayed in the box will represent JPY (base)/USD (quote).


Isenção de responsabilidade: Apenas para fins informativos. O desempenho passado não é indicativo de resultados futuros.
placeholder
O ouro recua em meio à contínua compra de USD, enquanto os traders aguardam o relatório adiado do NFP dos EUA.O ouro (XAU/USD) atrai novos vendedores após um aumento durante a sessão asiática para a região de US$ 4.110 nesta quinta-feira e recua ainda mais em relação à máxima semanal atingida no dia anterior.
Autor  FXStreet
13 horas atrás
O ouro (XAU/USD) atrai novos vendedores após um aumento durante a sessão asiática para a região de US$ 4.110 nesta quinta-feira e recua ainda mais em relação à máxima semanal atingida no dia anterior.
placeholder
Ibovespa cai antes do feriado; dólar sobe a R$ 5,33 com cautela e queda do petróleoO Ibovespa encerrou esta quarta-feira (19) em queda de 0,73%, aos 155.380,66 pontos, registrando uma perda de mais de 1.100 pontos. O movimento marca a terceira baixa consecutiva do índice, uma sequência negativa que não era vista desde o início de outubro.
Autor  Pedro Augusto Prazeres
15 horas atrás
O Ibovespa encerrou esta quarta-feira (19) em queda de 0,73%, aos 155.380,66 pontos, registrando uma perda de mais de 1.100 pontos. O movimento marca a terceira baixa consecutiva do índice, uma sequência negativa que não era vista desde o início de outubro.
placeholder
HGLG11 projeta alta na vacância para 2026; RZAK11 paga yield de 1,35% e RZAT11 reduz dividendoO fundo imobiliário CSHG Logística (HGLG11) divulgou seu relatório gerencial referente ao mês de outubro, informando um resultado distribuível de R$ 32,246 milhões. O montante representa um recuo em relação ao desempenho de setembro, quando o fundo havia registrado R$ 36,939 milhões.
Autor  Pedro Augusto Prazeres
15 horas atrás
O fundo imobiliário CSHG Logística (HGLG11) divulgou seu relatório gerencial referente ao mês de outubro, informando um resultado distribuível de R$ 32,246 milhões. O montante representa um recuo em relação ao desempenho de setembro, quando o fundo havia registrado R$ 36,939 milhões.
placeholder
Bitcoin (BTC) cai com ata do Fed; "Medo Extremo" e capitulação podem sinalizar fundoO Bitcoin (BTC) aprofundou sua correção nesta quarta-feira (19), caindo para baixo do patamar de US$ 89.000 e atingindo sua mínima em sete meses. O movimento de aversão ao risco foi intensificado pela divulgação das atas da reunião do Federal Reserve (Fed) realizada em 28 e 29 de outubro.
Autor  Pedro Augusto Prazeres
16 horas atrás
O Bitcoin (BTC) aprofundou sua correção nesta quarta-feira (19), caindo para baixo do patamar de US$ 89.000 e atingindo sua mínima em sete meses. O movimento de aversão ao risco foi intensificado pela divulgação das atas da reunião do Federal Reserve (Fed) realizada em 28 e 29 de outubro.
placeholder
A Semrush se une à Adobe para impulsionar a próxima geração de marketing generativo com IA.A Adobe adquire a Semrush por US$ 1,9 bilhão, integrando ferramentas de SEO e marketing com inteligência artificial para aumentar a visibilidade da marca em plataformas digitais e baseadas em IA.
Autor  Cryptopolitan
17 horas atrás
A Adobe adquire a Semrush por US$ 1,9 bilhão, integrando ferramentas de SEO e marketing com inteligência artificial para aumentar a visibilidade da marca em plataformas digitais e baseadas em IA.
Produtos relacionados
goTop
quote