USD/JPY Price Analysis: Tests 14-month lows; next support at 140.00

Fonte Fxstreet
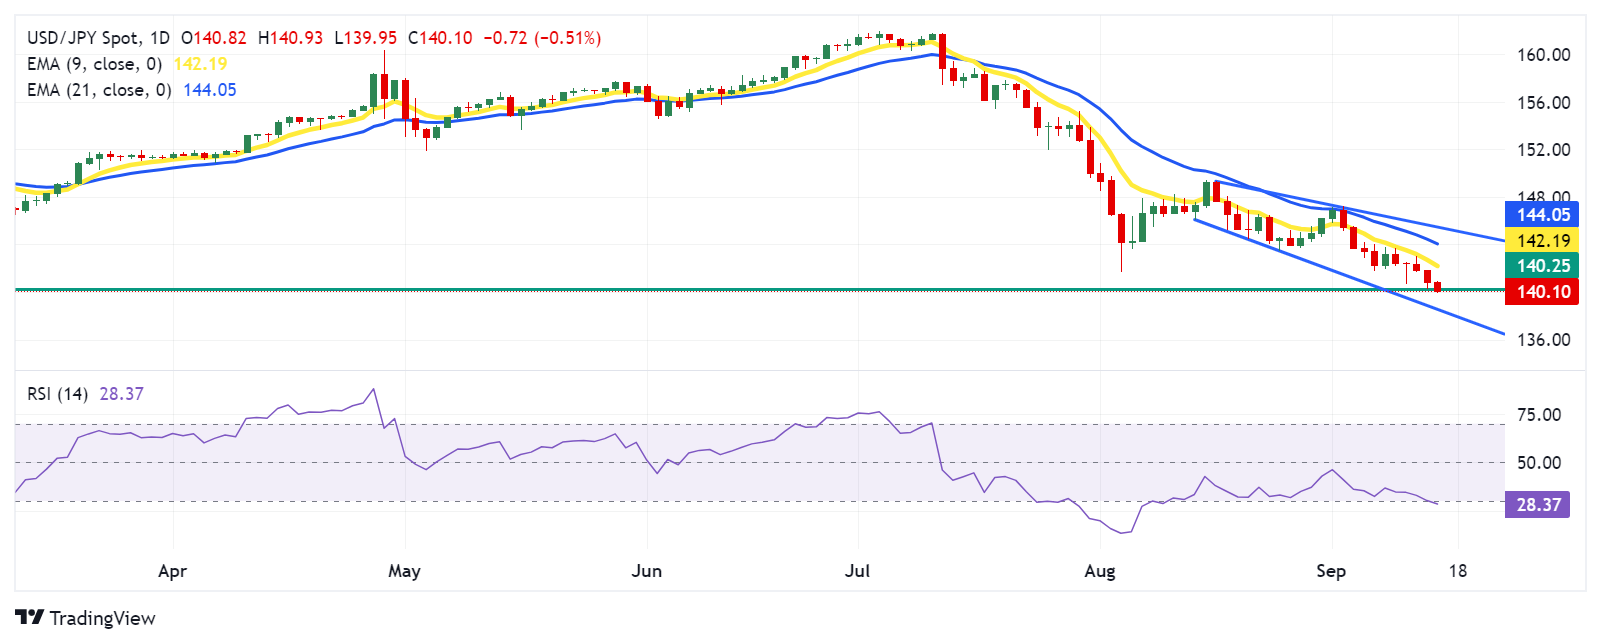
  • USD/JPY extends its losing streak within a descending channel, suggesting a confirmed bearish bias.
  • The momentum indicator 14-day RSI suggests an oversold situation and a potential for an upward correction soon.
  • The pair tests the 14-month low at 140.25, followed by the lower boundary of the channel at the 138.50 level.

USD/JPY continues to decline for the fifth consecutive day, trading around 140.30 during the Asian session on Monday. An analysis of the daily chart showed the USD/JPY pair moves downward within a descending channel, indicating a confirmed bearish bias.

Additionally, the nine-day Exponential Moving Average (EMA) is lower than the 21-day EMA, indicating a downward momentum in the asset's price. However, the 14-day Relative Strength Index (RSI), a momentum indicator, is positioned below the 30 level, suggesting an oversold situation for the USD/JPY pair and a potential for an upward correction soon.

In terms of support, the USD/JPY pair is testing 140.25, which is the lowest level since July 2023, followed by the psychological level of 140.00. A successful breach below this level could reinforce the bearish bias and put pressure on the pair to test the lower boundary of the descending channel at the level of 138.50.

On the upside, the USD/JPY pair might first encounter a barrier at the nine-day EMA around 142.19, followed by the 21-day EMA at 144.04 level. A break above these EMAs might weaken the bearish sentiment and push the pair to test the upper boundary of the descending channel at the 145.50 level.

USD/JPY: Daily Chart
Japanese Yen PRICE Today

The table below shows the percentage change of Japanese Yen (JPY) against listed major currencies today. Japanese Yen was the strongest against the US Dollar.

  USD EUR GBP JPY CAD AUD NZD CHF
USD   -0.21% -0.25% -0.41% -0.16% -0.33% -0.22% -0.19%
EUR 0.21%   -0.10% -0.23% 0.01% -0.18% -0.07% -0.03%
GBP 0.25% 0.10%   -0.22% 0.10% -0.09% 0.04% 0.08%
JPY 0.41% 0.23% 0.22%   0.25% 0.13% 0.20% 0.15%
CAD 0.16% -0.01% -0.10% -0.25%   -0.25% -0.06% -0.14%
AUD 0.33% 0.18% 0.09% -0.13% 0.25%   0.12% 0.14%
NZD 0.22% 0.07% -0.04% -0.20% 0.06% -0.12%   0.04%
CHF 0.19% 0.03% -0.08% -0.15% 0.14% -0.14% -0.04%  

The heat map shows percentage changes of major currencies against each other. The base currency is picked from the left column, while the quote currency is picked from the top row. For example, if you pick the Japanese Yen from the left column and move along the horizontal line to the US Dollar, the percentage change displayed in the box will represent JPY (base)/USD (quote).

Isenção de responsabilidade: Apenas para fins informativos. O desempenho passado não é indicativo de resultados futuros.
placeholder
Previsão do preço do ouro: XAU/USD se mantém abaixo de US$ 3.350 com o dólar americano mais firme e a diminuição das tensões comerciais entre EUA e ChinaO preço do ouro (XAU / USD) perde terreno para cerca de US $ 3.335 durante o início da sessão asiática de terça-feira. O metal amarelo cai em meio a uma modesta recuperação do dólar americano (USD) e a um abrandamento das tensões entre os Estados Unidos e a China.
Autor  FXStreet
4 Mês 29 Dia Ter
O preço do ouro (XAU / USD) perde terreno para cerca de US $ 3.335 durante o início da sessão asiática de terça-feira. O metal amarelo cai em meio a uma modesta recuperação do dólar americano (USD) e a um abrandamento das tensões entre os Estados Unidos e a China.
placeholder
O preço do ouro cai para uma nova baixa de duas semanas, ficando ainda mais abaixo de US$ 3.300 antes dos dados do PCE dos EUAO preço do ouro (XAU/USD) atrai novos vendedores após o movimento sem direção do preço no dia anterior e recua para abaixo da marca de US$ 3.300 durante o pregão asiático desta sexta-feira.
Autor  FXStreet
6 Mês 27 Dia Sex
O preço do ouro (XAU/USD) atrai novos vendedores após o movimento sem direção do preço no dia anterior e recua para abaixo da marca de US$ 3.300 durante o pregão asiático desta sexta-feira.
placeholder
Baleia de Bitcoin liquida R$ 52 bilhões após 14 anos e movimenta o mercadoUm dos maiores eventos de realização de lucros da história do Bitcoin movimentou o mercado nesta semana.
Autor  Pedro Augusto Prazeres
7 Mês 21 Dia Seg
Um dos maiores eventos de realização de lucros da história do Bitcoin movimentou o mercado nesta semana.
placeholder
Ouro se recupera após atingir o menor valor em duas semanas em meio à desvalorização do dólar americano e às apostas na redução das taxas de juros pelo Fed; otimismo comercial limita ganhosO ouro (XAU/USD) atrai alguns compradores durante a sessão asiática desta terça-feira e recupera parte das perdas do dia anterior, para a região de US$ 3.972-3.971, ou uma baixa de mais de duas semanas.
Autor  FXStreet
10 Mês 28 Dia Ter
O ouro (XAU/USD) atrai alguns compradores durante a sessão asiática desta terça-feira e recupera parte das perdas do dia anterior, para a região de US$ 3.972-3.971, ou uma baixa de mais de duas semanas.
placeholder
RBRR11 avança em incorporação do PULV11; RECT11 tem salto de 165% no lucro com venda de ativosO fundo imobiliário RBR Rendimento High Grade (RBRR11), da RBR Asset, reportou um lucro de R$ 13,4 milhões em seu relatório gerencial de setembro. Com base nesse resultado, o fundo anunciou a distribuição de R$ 0,80 por cota.
Autor  Pedro Augusto Prazeres
11 Mês 14 Dia Sex
O fundo imobiliário RBR Rendimento High Grade (RBRR11), da RBR Asset, reportou um lucro de R$ 13,4 milhões em seu relatório gerencial de setembro. Com base nesse resultado, o fundo anunciou a distribuição de R$ 0,80 por cota.
Produtos relacionados
goTop
quote