USD/NOK with light losses on quiet Friday, cautious Fed supports the USD

Fonte Fxstreet
  • USD/NOK saw mild losses on Friday’s session, around 10.66.
  • Despite mixed reactions to softening economic data, the Dollar remains steady due to a cautious stance from Fed officials.
  • The Fed recognized progress but that it needs further data to start cutting.

The USD/NOK stands mildly down on Friday with the Greenback holding its ground thanks to the cautious tone of the Federal Reserve (Fed) officials. They mention that the Consumer Price Index (CPI) figures have yet to meet the Fed's desired targets which makes the market attach to their bets of the easing starting in September.

Fed officials, including Raphael Bostic, Loretta Mester, and Thomas Barkin, have adopted a cautious stance in light of recent US economic data. Despite softening figures, the US Dollar has remained resilient, reflecting confidence in the existing monetary policy. The difficulty appears in the inflation trajectory, with Bostic and Mester both emphasizing the necessity of awaiting further data before deciding on potential rate adjustments. Barkin's remarks echo this cautious mindset, noting that the current CPI does not reflect the Fed’s target for inflation, suggesting possible adjustments in the near future.

USD/NOK technical analysis

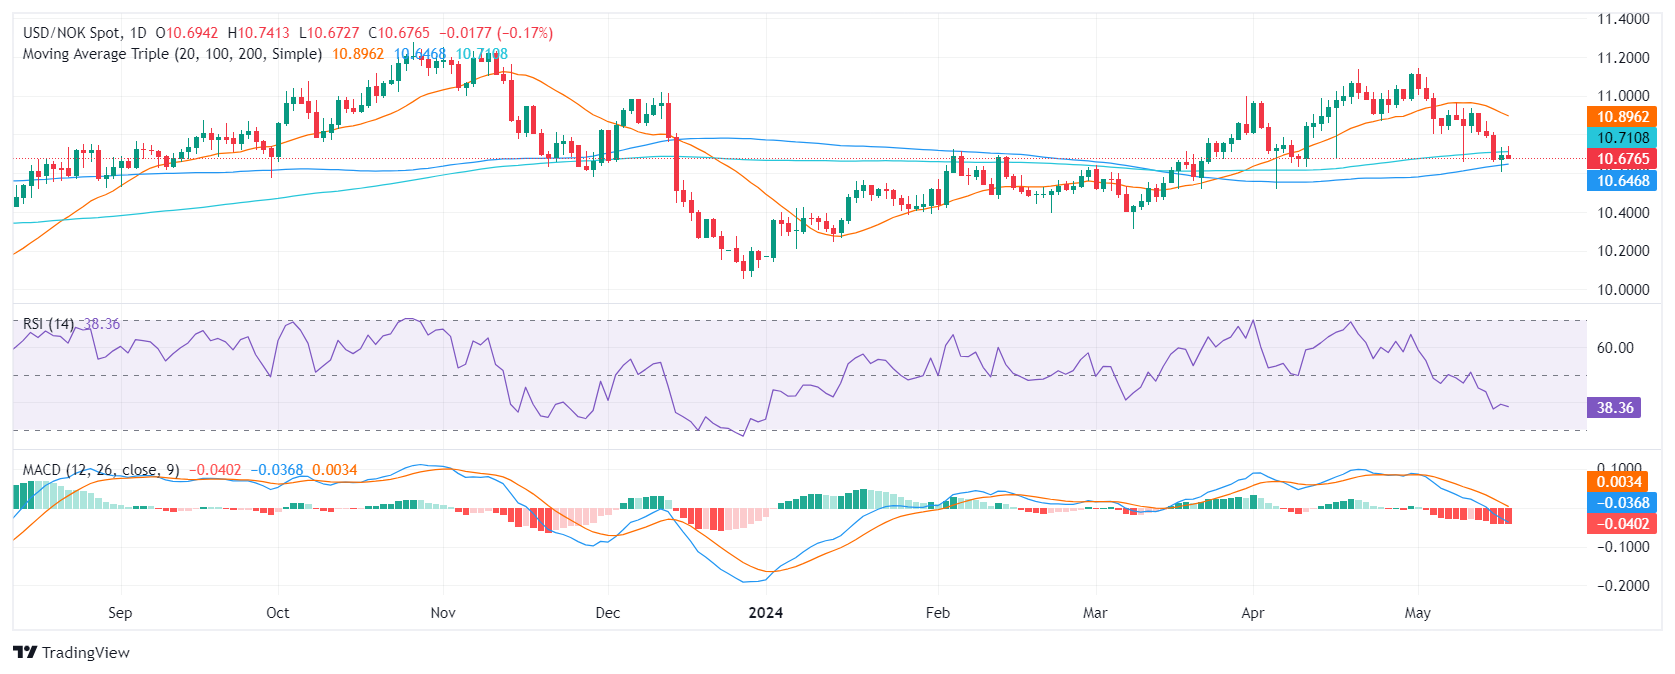
On the daily chart, the Relative Strength Index (RSI) for the USD/NOK pair is in negative territory, marking an overall bearish momentum. There is a gradual descent, indicating a continuous sell-off with no immediate signs of reversal. Meanwhile, the Moving Average Convergence Divergence (MACD) histogram produces flat red bars, suggesting a stable negative momentum supplementing further support to the prevailing downward pressure.

USD/NOK daily chart

When considering the Simple Moving Average (SMA) analysis, the pair can be seen between the 200 and 100-day SMAs which reflects a negative outlook in the overall trend. On the short-term, the outlook also favors the bears as the pair stands below the 20-day SMA.


USD/NOK

Overview
Today last price 10.68
Today Daily Change -0.0142
Today Daily Change % -0.13
Today daily open 10.6942
 
Trends
Daily SMA20 10.9133
Daily SMA50 10.8101
Daily SMA100 10.6417
Daily SMA200 10.7096
 
Levels
Previous Daily High 10.7331
Previous Daily Low 10.6045
Previous Weekly High 10.9612
Previous Weekly Low 10.6571
Previous Monthly High 11.1373
Previous Monthly Low 10.518
Daily Fibonacci 38.2% 10.684
Daily Fibonacci 61.8% 10.6537
Daily Pivot Point S1 10.6214
Daily Pivot Point S2 10.5487
Daily Pivot Point S3 10.4929
Daily Pivot Point R1 10.75
Daily Pivot Point R2 10.8059
Daily Pivot Point R3 10.8786


Isenção de responsabilidade: Apenas para fins informativos. O desempenho passado não é indicativo de resultados futuros.
placeholder
USD/JPY se aproxima da máxima em quase dois anos perto de 161,75, com risco de intervenção no radarO USD/JPY subiu para perto de 161,75, impulsionado pela força do dólar diante das tensões no Oriente Médio e da postura hawkish do Fed, mas o risco de intervenção japonesa e sinais de sobrecompra sugerem cautela.
Autor  FXStreet
11 horas atrás
O USD/JPY subiu para perto de 161,75, impulsionado pela força do dólar diante das tensões no Oriente Médio e da postura hawkish do Fed, mas o risco de intervenção japonesa e sinais de sobrecompra sugerem cautela.
placeholder
Prata avança acima de US$ 66, mas XAG/USD segue abaixo de resistência-chave em tendência de baixa mais amplaA prata avançou acima de US$ 66 com o progresso do acordo entre EUA e Irã, mas o XAG/USD segue abaixo da média móvel de 100 dias, mantendo uma estrutura técnica baixista.
Autor  FXStreet
11 horas atrás
A prata avançou acima de US$ 66 com o progresso do acordo entre EUA e Irã, mas o XAG/USD segue abaixo da média móvel de 100 dias, mantendo uma estrutura técnica baixista.
placeholder
Ouro enfraquece abaixo de US$ 4.200 com Fed hawkish e incerteza sobre Irã impulsionando o dólarO ouro caiu abaixo de US$ 4.200, pressionado pela postura hawkish do Fed, pela força do dólar e pela incerteza nas negociações entre EUA e Irã, enquanto os indicadores técnicos seguem favorecendo os vendedores.
Autor  FXStreet
6 Mês 19 Dia Sex
O ouro caiu abaixo de US$ 4.200, pressionado pela postura hawkish do Fed, pela força do dólar e pela incerteza nas negociações entre EUA e Irã, enquanto os indicadores técnicos seguem favorecendo os vendedores.
placeholder
Atividade on-chain do Bitcoin atinge máxima de 2026 apesar da estagnação do preço O preço do Bitcoin segue pressionado, mas a atividade on-chain atingiu a máxima de 2026 com o aumento de transações de baixo valor impulsionadas por protocolos baseados em OP_RETURN, elevando o congestionamento da mempool.
Autor  FXStreet
6 Mês 19 Dia Sex
O preço do Bitcoin segue pressionado, mas a atividade on-chain atingiu a máxima de 2026 com o aumento de transações de baixo valor impulsionadas por protocolos baseados em OP_RETURN, elevando o congestionamento da mempool.
placeholder
Ouro hesita abaixo de US$ 4.300 com alta nas apostas de aumento de juros pelo FedO ouro hesita abaixo de US$ 4.300 com a postura hawkish do Fed e o aumento das apostas de alta de juros neste ano, enquanto resistências em US$ 4.370 e US$ 4.400 limitam a recuperação.
Autor  FXStreet
6 Mês 18 Dia Qui
O ouro hesita abaixo de US$ 4.300 com a postura hawkish do Fed e o aumento das apostas de alta de juros neste ano, enquanto resistências em US$ 4.370 e US$ 4.400 limitam a recuperação.
Produtos relacionados
goTop
quote