


Crypto Today: Bitcoin, Ethereum, XRP recovery slows amid ETF inflows, US-Iran persistent strikes
- Bitcoin’s rebound stalls, with the $66,000 level providing immediate support amid US-Iran continued attacks.
- Ethereum remains stable above $1,900 support while the 100-day EMA caps the upside and ETFs keep registering inflows.
- XRP bulls take a breather after five consecutive days of gains, supported by a MACD buy signal and mild capital inflows.
Bitcoin (BTC) trades elevated above $66,000 immediate support on Wednesday, following a minor correction from its weekly high of $66,956. The broader crypto market appears to lag on the backdrop of the macro-driven rally, with Ethereum (ETH) hovering above $1,900 and Ripple (XRP) holding support at $1.13.
Crypto ETFs attract interest despite sustained US-Iran attacks
Global markets remain on edge as the United States (US) military reported continued strikes on Iranian “military sites.” According to a CNN report, the strikes hit cities in western and southern Iran.
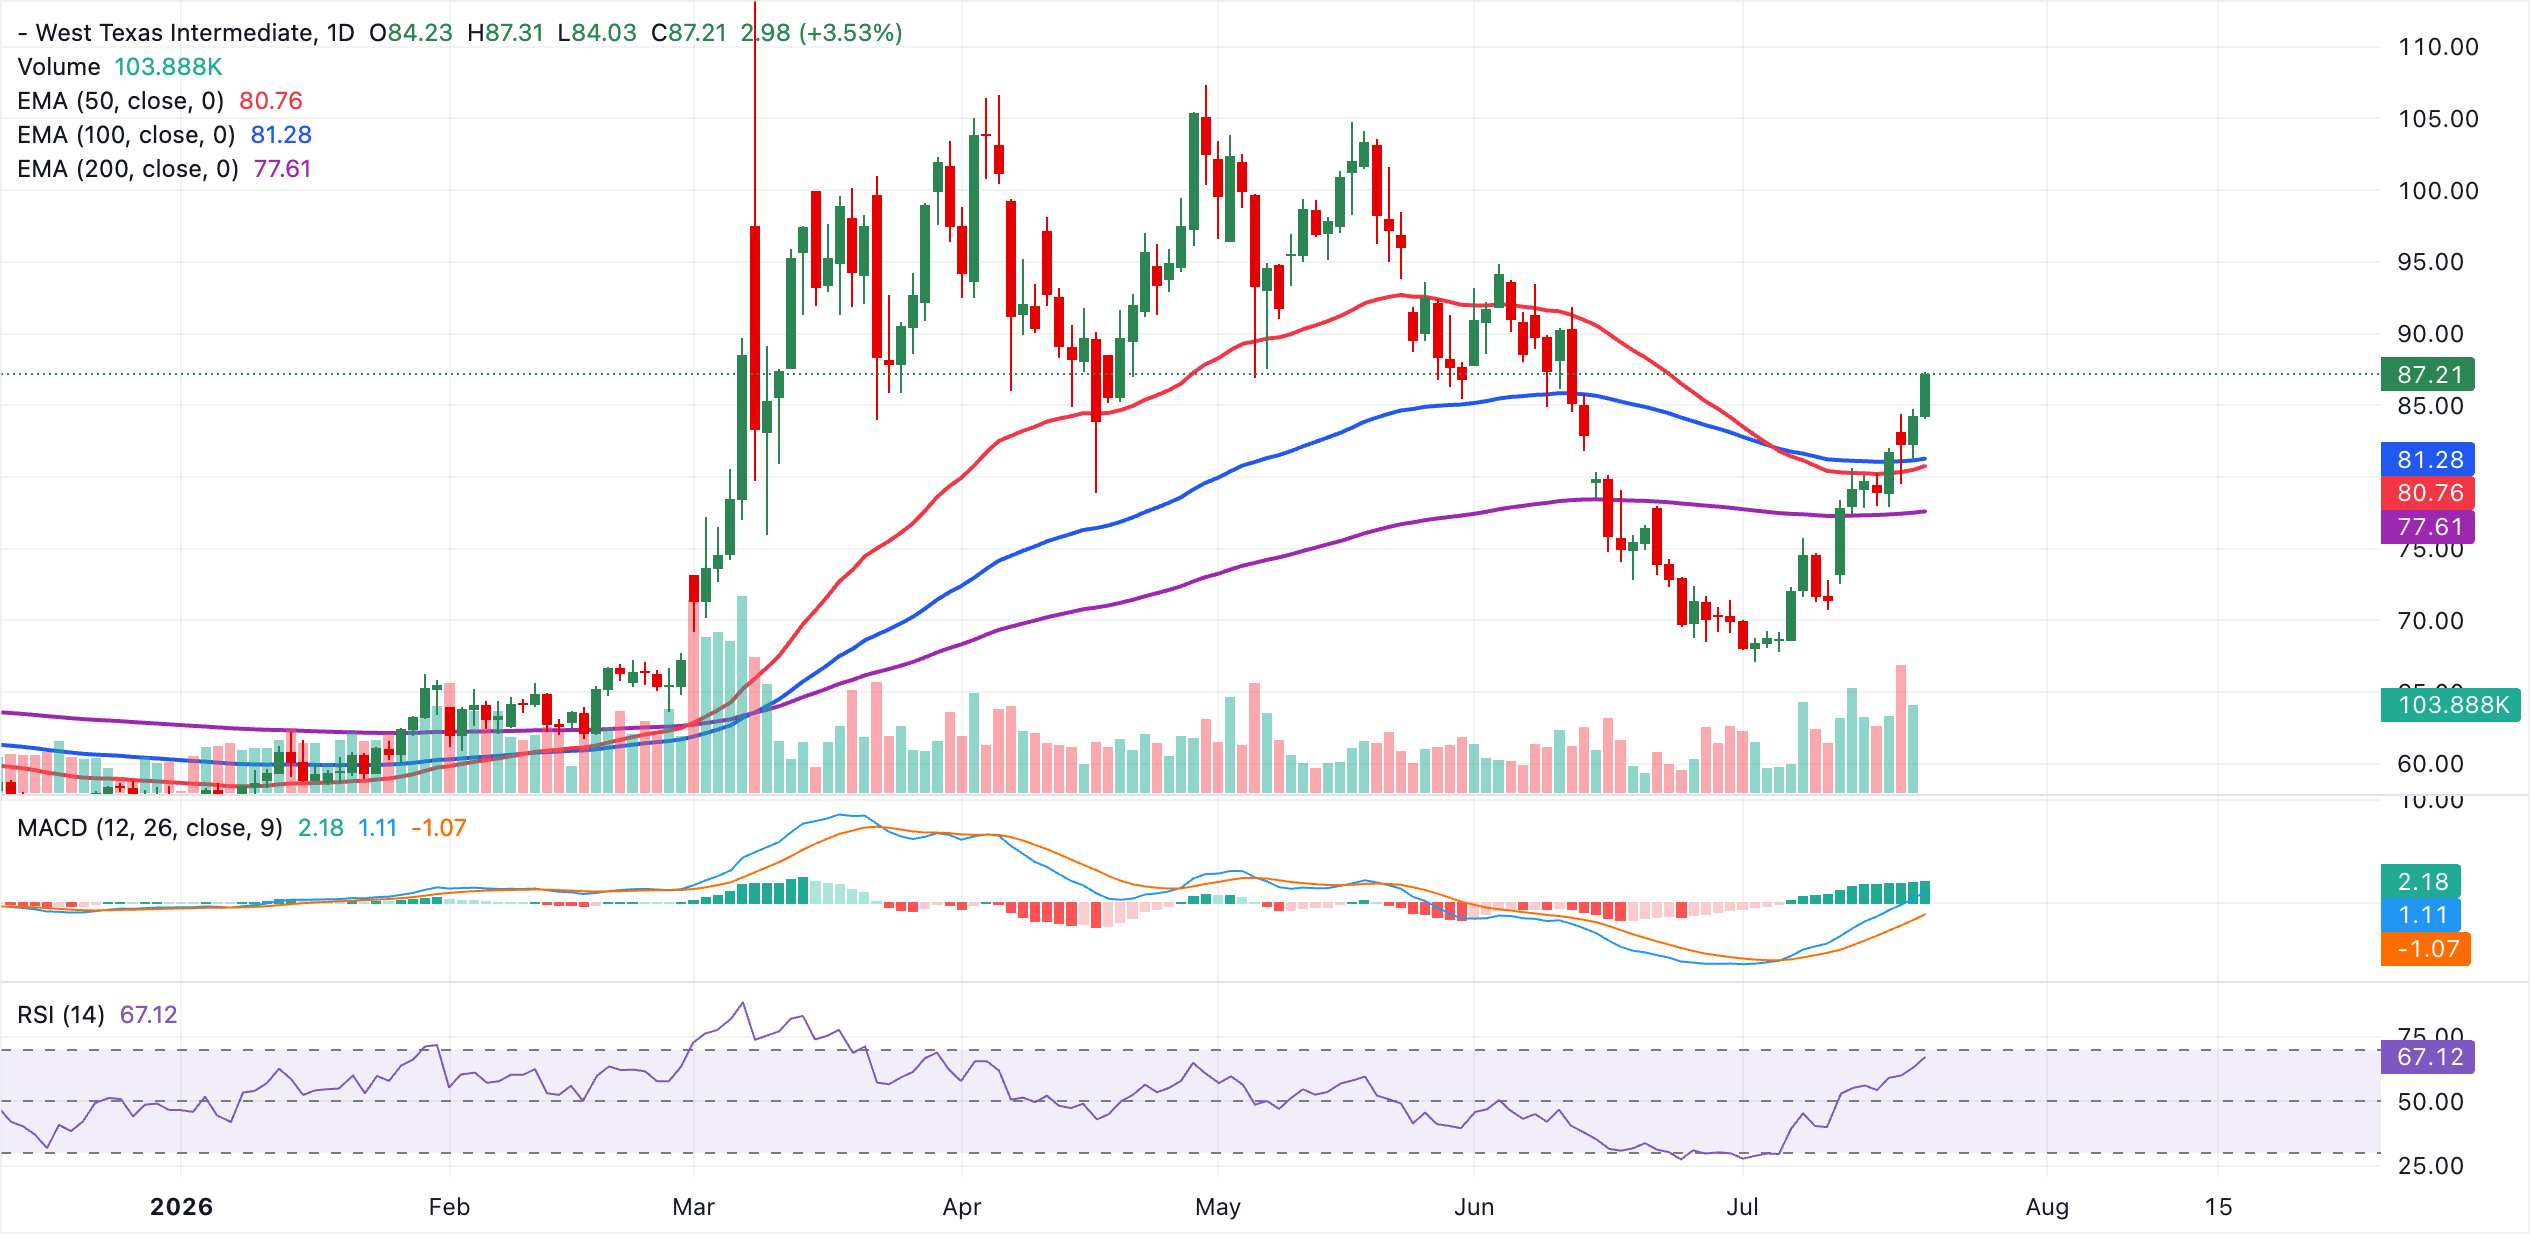
Meanwhile, West Texas Intermediate (WTI) Crude Oil prices have sustained a rally since the beginning of July, trading above $87 on Wednesday.
US Secretary of State Marco Rubio is reported to have said that Iran is “not serious about talks” and cautioned of the risk of creating a “dangerous precedent” in allowing Iran to control the Strait of Hormuz.
Despite the persistent geopolitical tensions in the Middle East, the broader crypto market sentiment edged higher. According to the Fear & Greed Index, sentiment is currently in Fear territory at 33, up from 25 on Tuesday.
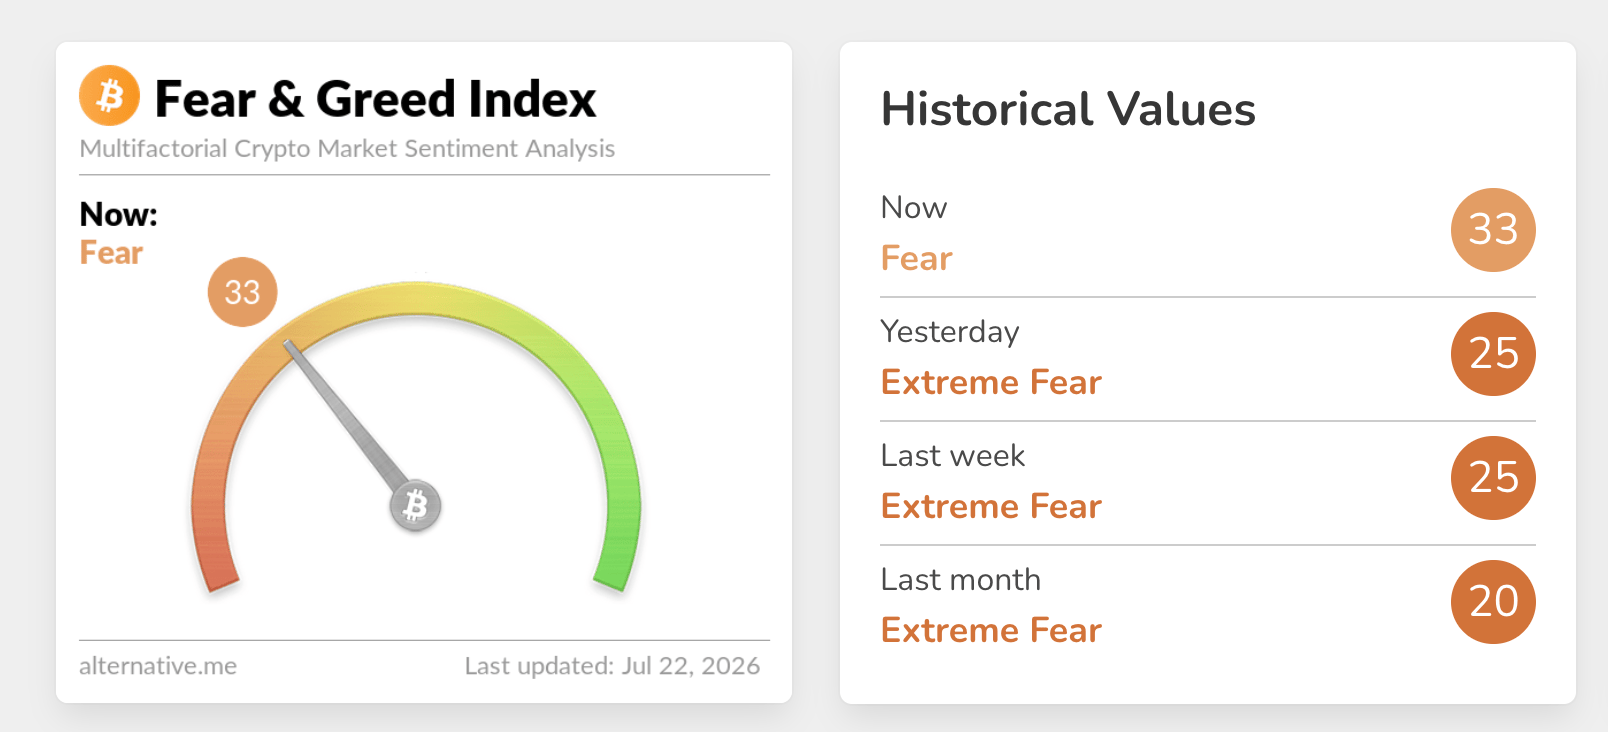
The uptick aligns with rising prices and suggests that investors are shifting their focus away from geopolitics, possibly due to positive signs of inflation easing in the world’s largest economy.
“Macro did the constructive work. A softer June CPI on 14 July reinforced the case that the Fed stays on hold, and the market now prices a 94% probability of no change at the 28 to 29 July meeting. For a non-yielding asset pressured all year by higher-for-longer rates, removing near-term hike risk is the most supportive development available, and it is showing up in flows,” Yusuf Fakhro, Partner at ARP Digital, said in a comment.
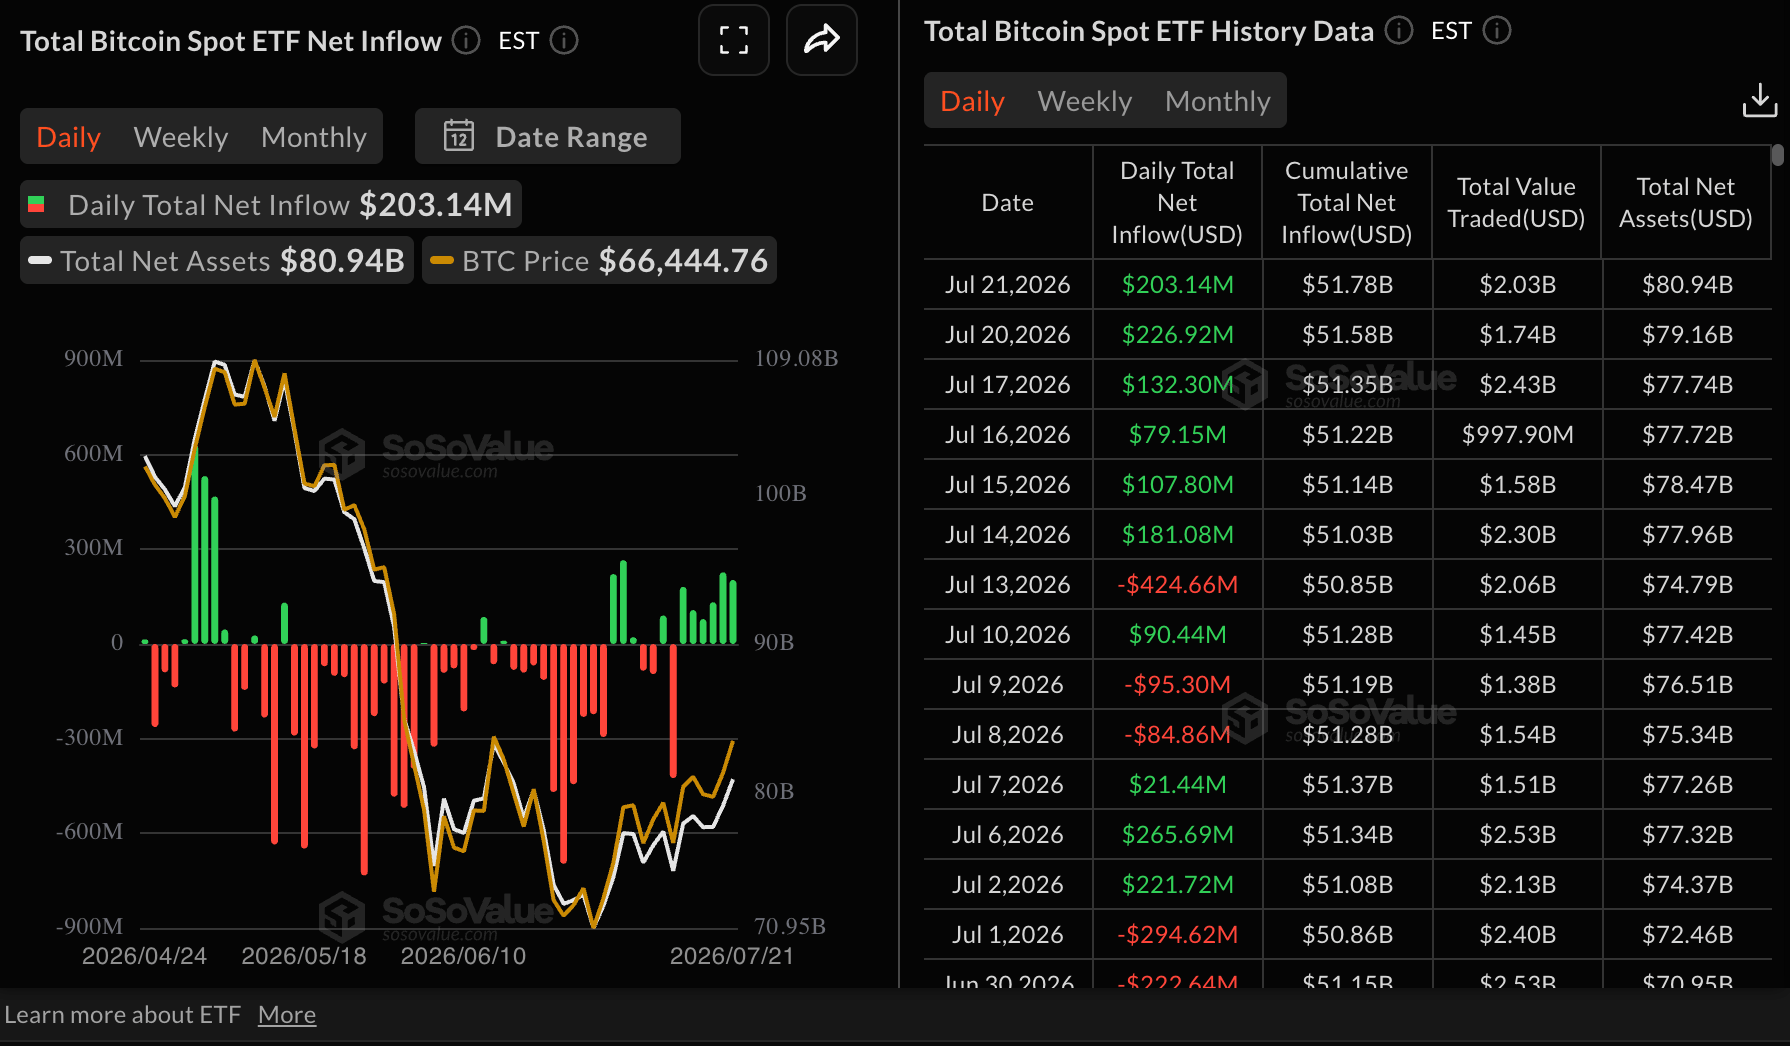
Institutional interest in Bitcoin spot Exchange-Traded Funds (ETFs) remains steady for a sixth consecutive day, with inflows dropping marginally to $203 million on Tuesday, from $227 million the previous day. According to SoSoValue data, cumulative inflows stand at nearly $51.78 billion, while net assets under management average $80.94 billion, underscoring long-term institutional interest in Bitcoin spot ETFs.
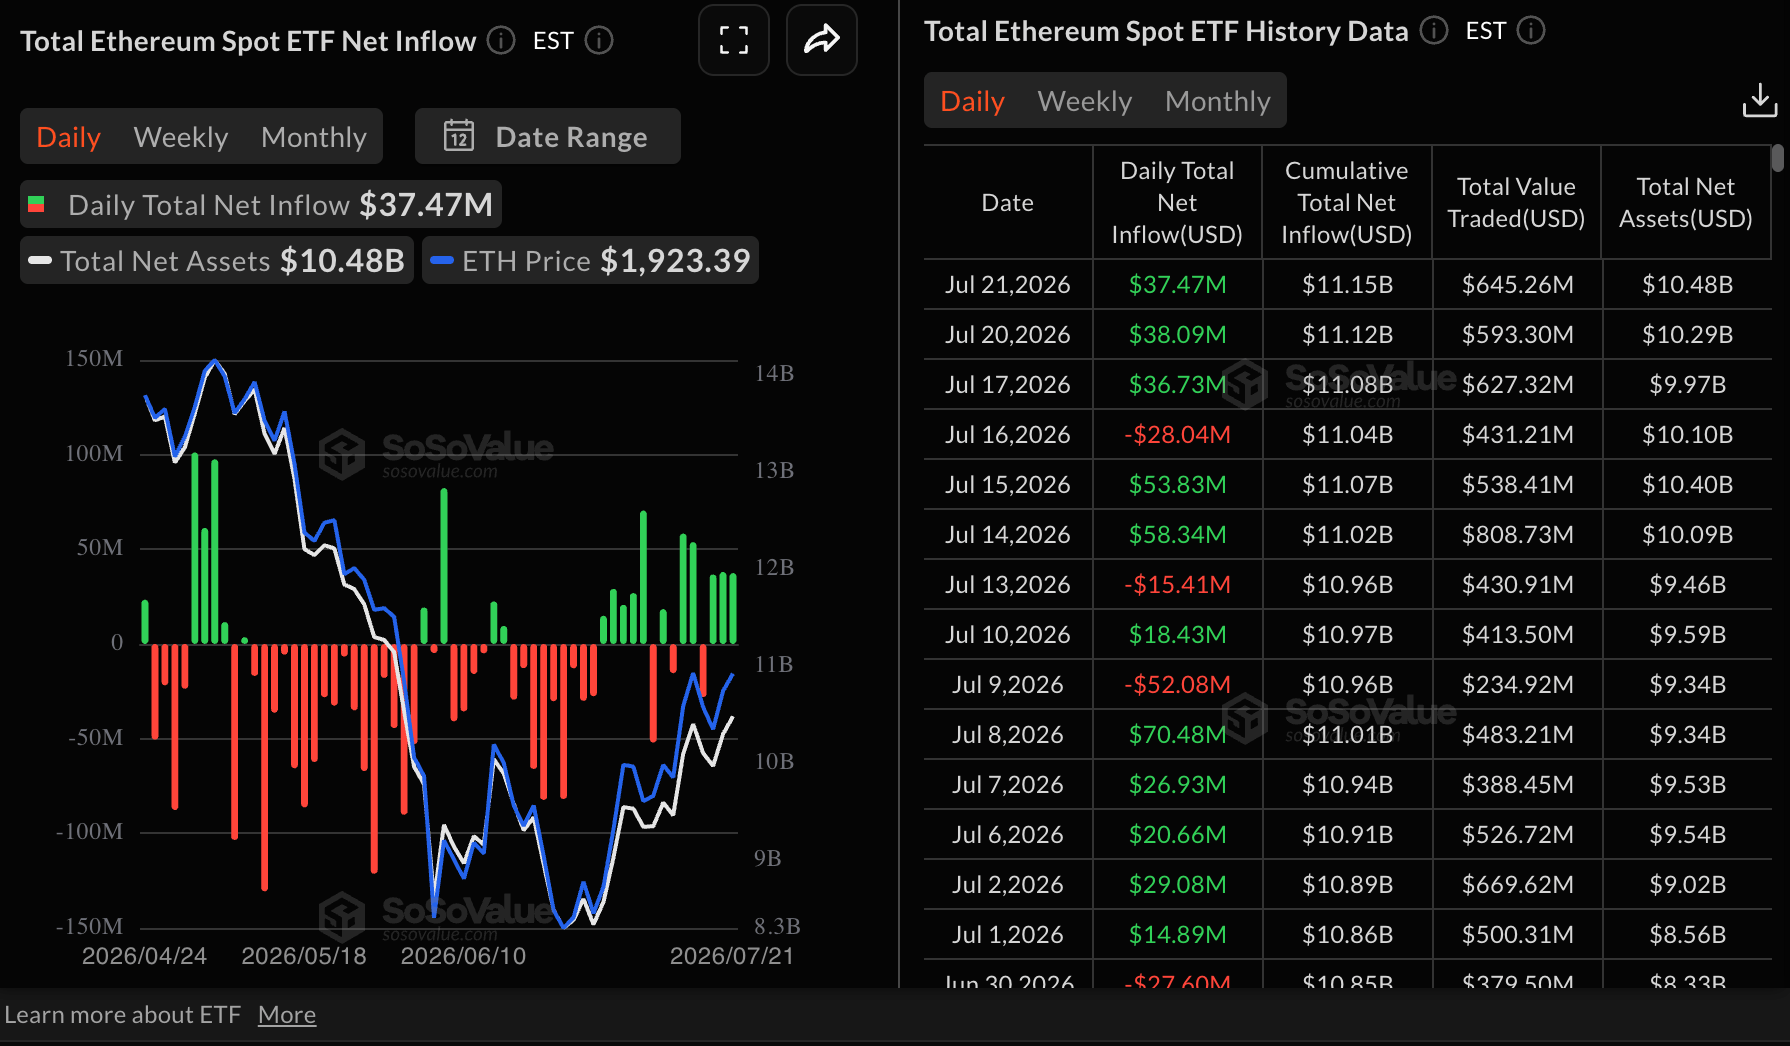
Demand for Ethereum spot ETFs is making a gradual comeback, as evidenced by inflows of $37 million on Tuesday, down slightly from $38 million on Monday.
Cumulative inflows increased only marginally to $11.15 billion, from $11.12 billion in the same period. Meanwhile, assets under management averaged $10.48 billion, up from Monday’s $11.29 billion.
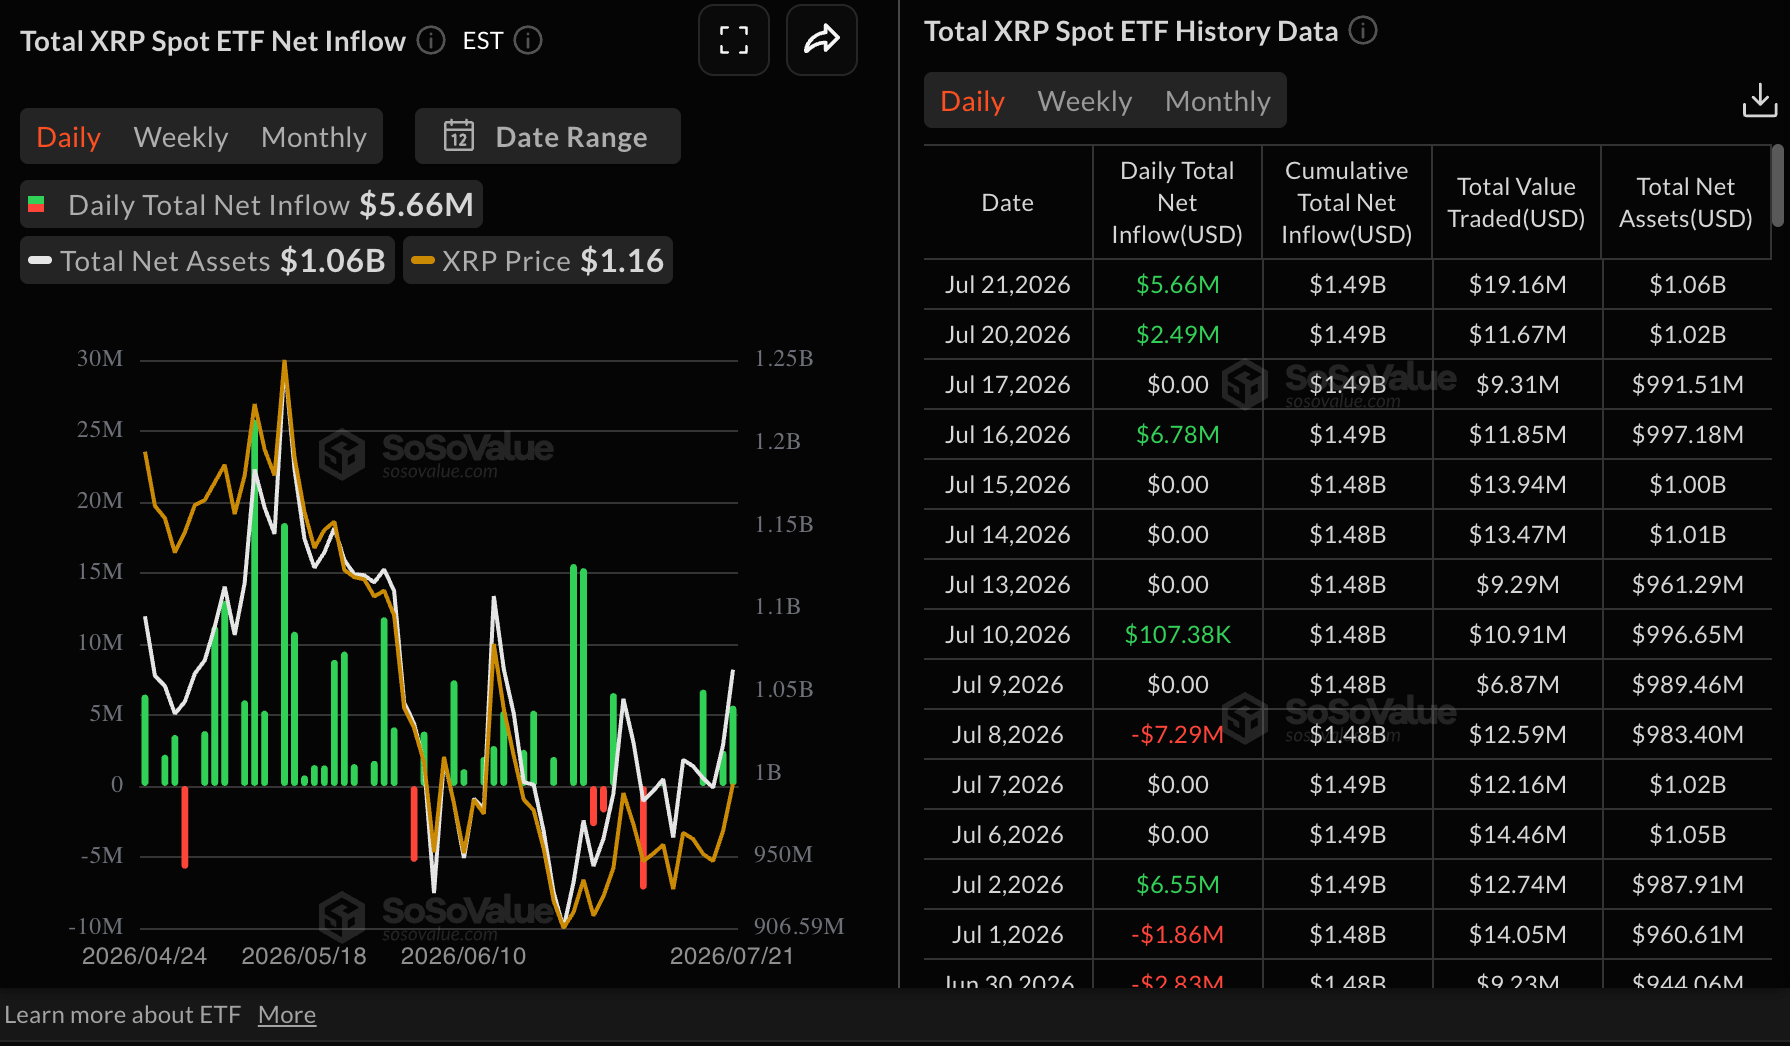
Appetite for XRP spot ETFs shows mild signs of picking up, with inflows totaling $5.7 million on Tuesday, up slightly from $2.5 million the day before. Cumulative inflows remain steady at $1.49 billion, with total assets under management standing at $1.06 billion. Interest in XRP spot ETFs still lags Bitcoin and Ethereum, which continue to attract larger flow volumes.
Price analysis: Bitcoin defends key support as buyers hold the line
Bitcoin trades above $66,000, maintaining a constructive bullish bias as price holds above the SuperTrend at $61,152 and the 50-day Exponential Moving Average (EMA) at $65,138. Still, the pair hovers beneath the 100-day EMA at $68,067 and the 200-day EMA at $73,835, suggesting room for further recovery before challenging the broader downtrend context.
A positive Moving Average Convergence Divergence (MACD) on the daily chart and the Relative Strength Index (RSI) near 59 reinforce improving upside momentum.
-1784712964737.png)
On the topside, initial resistance emerges at the 100-day EMA at $68,067, with a more significant hurdle at the 200-day EMA near $73,835 where the medium-term bearish structure would be tested. On the downside, immediate support is seen at the 50-day EMA at $65,138, followed by the SuperTrend line at $61,152 and the previously broken downward trendline zone around $60,486, levels that would need to give way to signal a deeper corrective phase.
Altcoins outlook: Ethereum and XRP pause rebound but hold key support
Ethereum trades at above $1,900, holding a bullish near-term bias as price sits above the 50-day EMA at $1,827 and the SuperTrend baseline at $1,739. The pair is attempting to reclaim higher ground but remains just under the 100-day EMA at $1,938, while the longer-term 200-day EMA at $2,189 still looms overhead, suggesting the broader recovery is incomplete.
The RSI at 63 on the daily chart stays in positive territory but not yet overbought, and the MACD indicator shows the line still in positive ground, hinting at constructive momentum even as upside is increasingly tested by moving-average resistance.
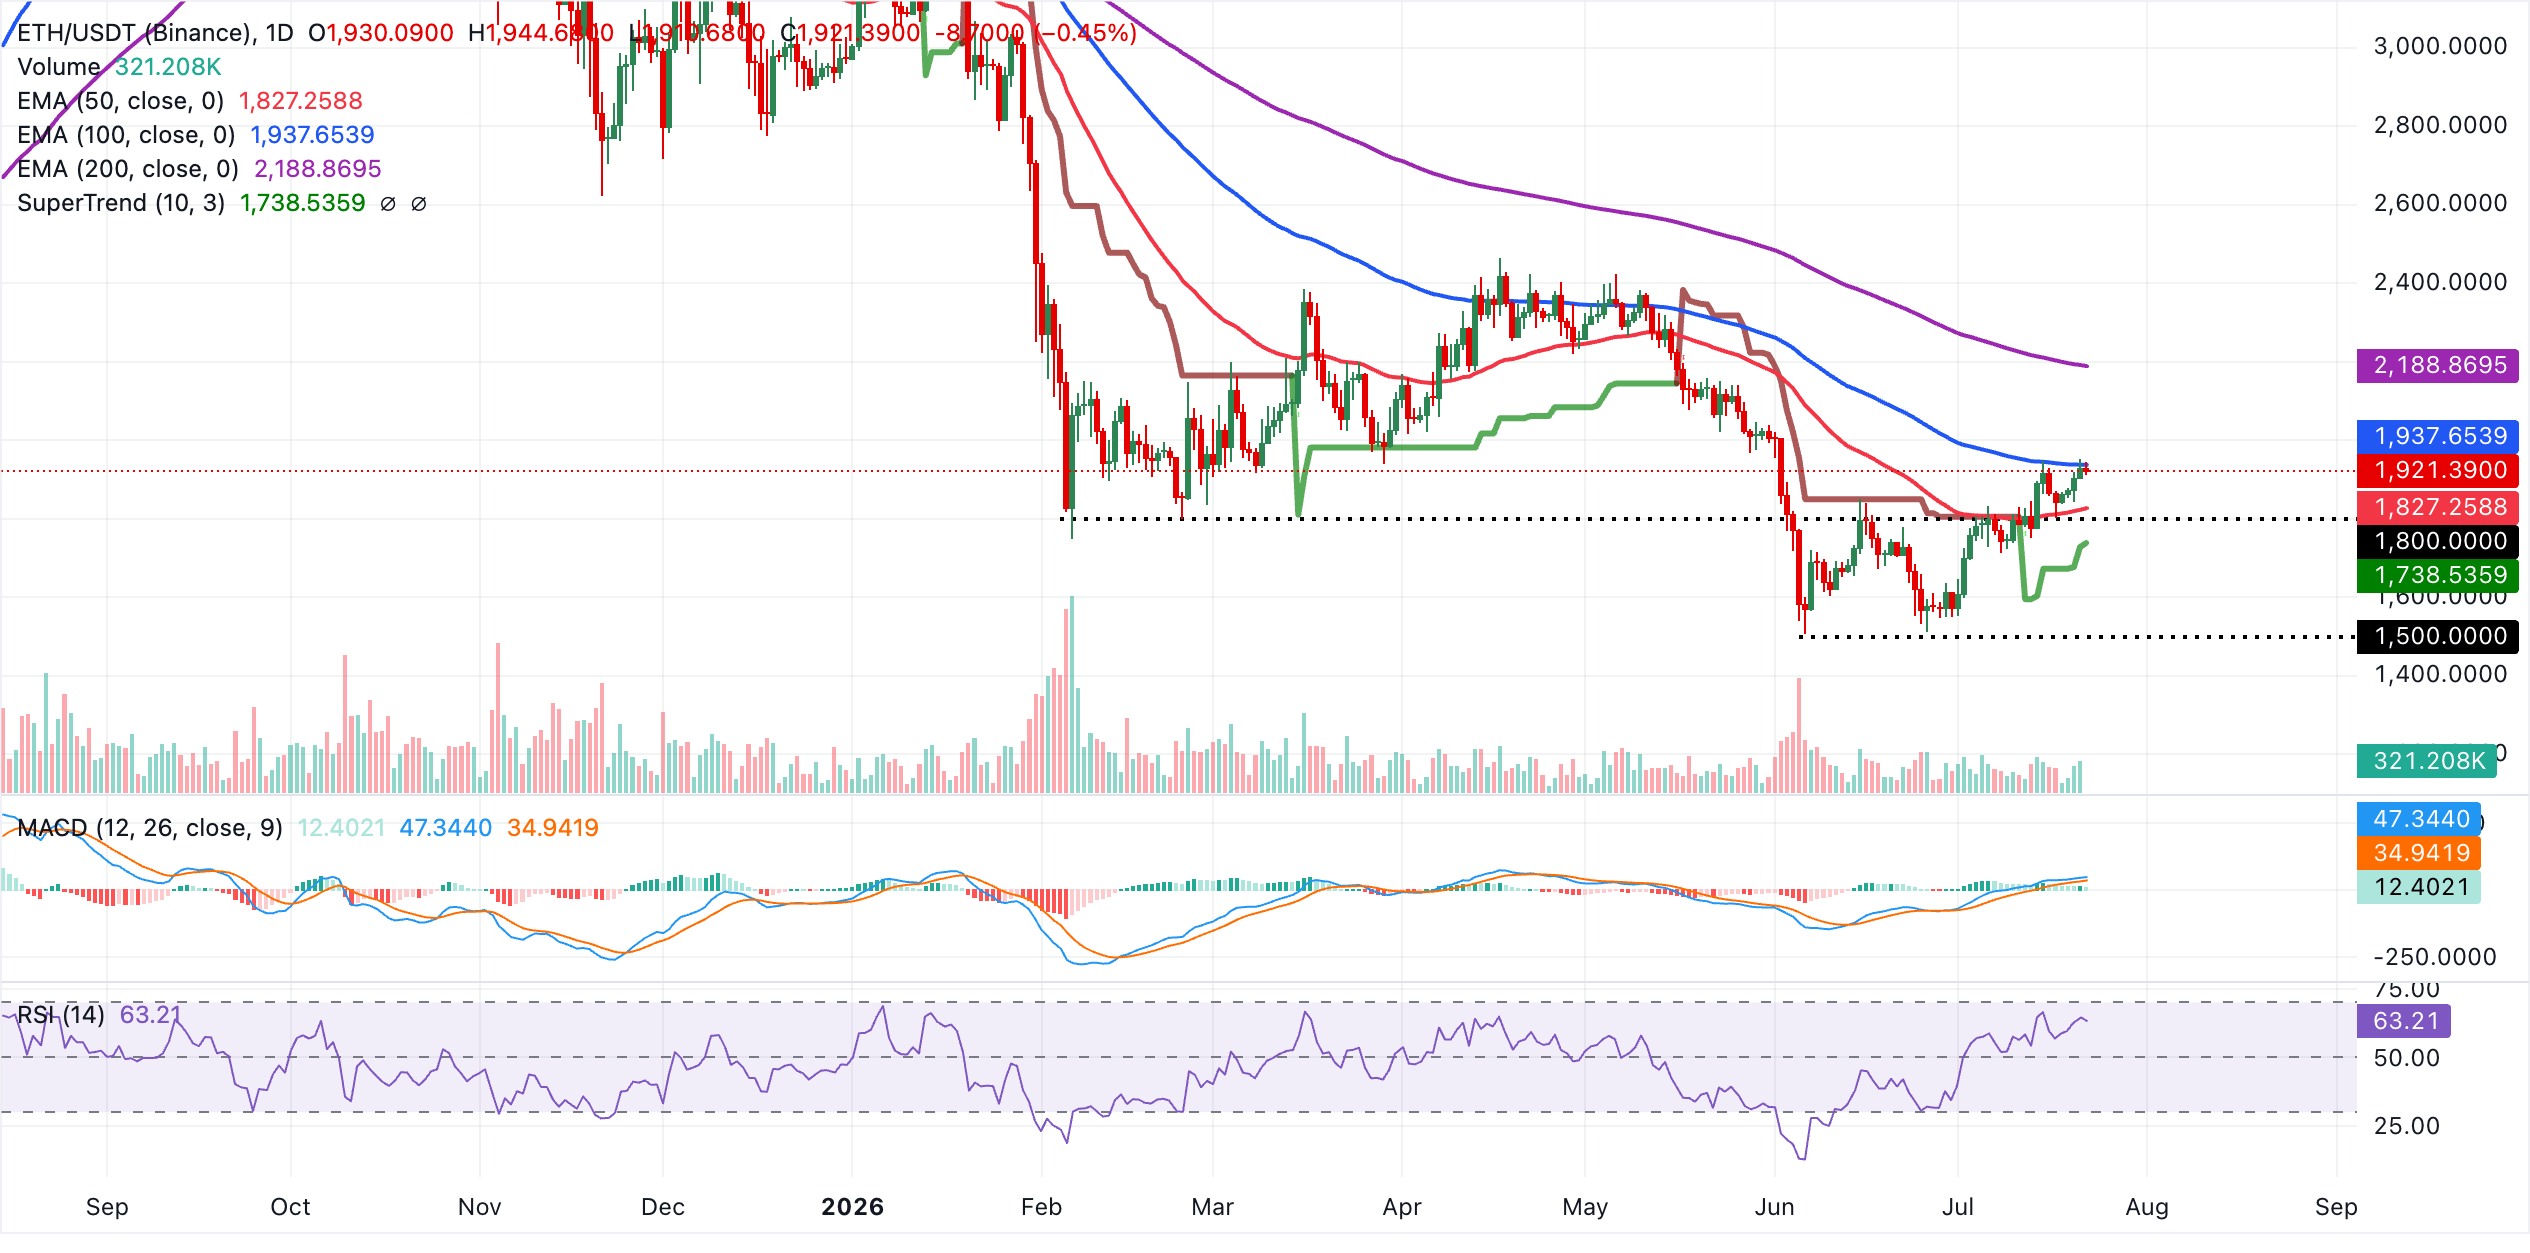
On the topside, immediate resistance is seen at the 100-day EMA at $1,938, followed by the more meaningful barrier at the 200-day EMA near $2,189, where buyers could encounter stronger supply. On the downside, initial support is provided by the 50-day EMA at $1,827, with a deeper pullback likely finding secondary demand around the SuperTrend line at $1,739. A daily close below this latter area would weaken the current bullish structure and expose a broader corrective phase.
XRP, on the other hand, trades around $1.13, remaining capped beneath a dense layer of moving average and trend resistance. The pair is still under the 50-day EMA at $1.15, the SuperTrend line at $1.18 and the longer-term 100-day and 200-day EMAs at $1.24 and $1.44 respectively, which collectively reinforce a bearish near-term bias despite the recent recovery.
Momentum is more constructive, with the RSI hovering near 55 on the daily chart and the MACD in positive territory, but this improving tone only hints at waning downside pressure rather than a clear bullish reversal.
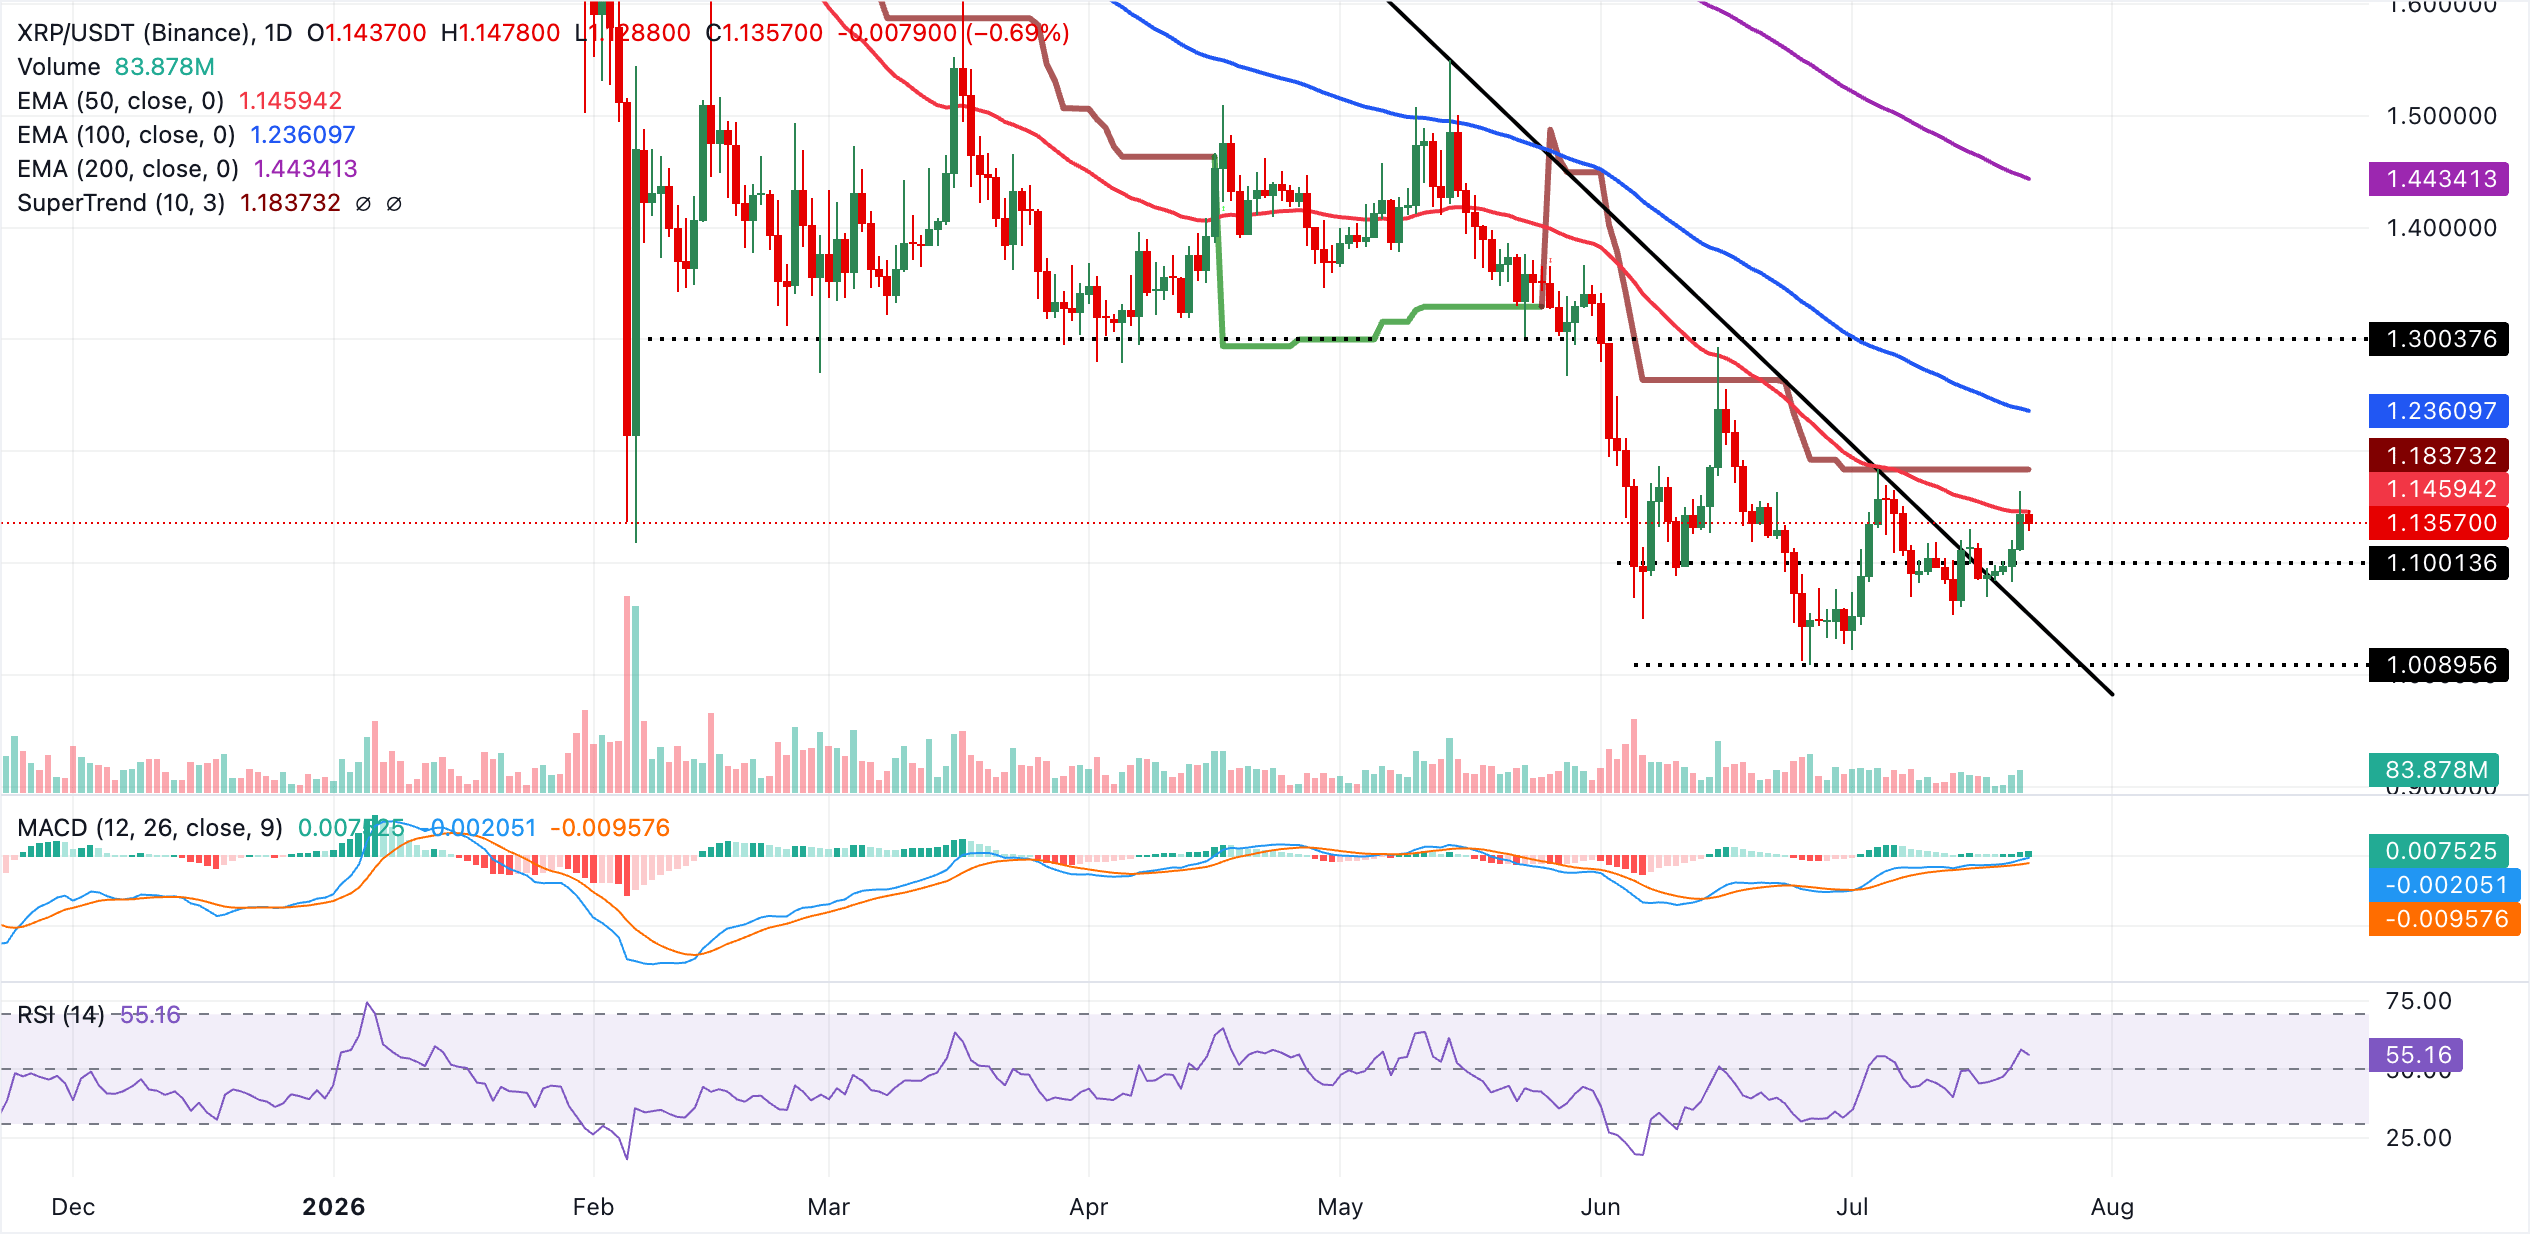
On the topside, immediate resistance emerges at the 50-day EMA around $1.15, followed by the SuperTrend level near $1.18, where further advances would likely meet supply. Above that, the 100-day EMA at $1.24 and the 200-day EMA at $1.44 mark more significant hurdles within the broader downtrend. On the downside, the descending trendline break price at $1.05 stands as the next notable support. A daily close back toward or below this level would reopen the path for a deeper pullback in the coming sessions.
(The technical analysis of this story was written with the help of an AI tool. Know more.)
Crypto ETF FAQs
An Exchange-Traded Fund (ETF) is an investment vehicle or an index that tracks the price of an underlying asset. ETFs can not only track a single asset, but a group of assets and sectors. For example, a Bitcoin ETF tracks Bitcoin’s price. ETF is a tool used by investors to gain exposure to a certain asset.
Yes. The first Bitcoin futures ETF in the US was approved by the US Securities & Exchange Commission in October 2021. A total of seven Bitcoin futures ETFs have been approved, with more than 20 still waiting for the regulator’s permission. The SEC says that the cryptocurrency industry is new and subject to manipulation, which is why it has been delaying crypto-related futures ETFs for the last few years.
Yes. The SEC approved in January 2024 the listing and trading of several Bitcoin spot Exchange-Traded Funds, opening the door to institutional capital and mainstream investors to trade the main crypto currency. The decision was hailed by the industry as a game changer.
The main advantage of crypto ETFs is the possibility of gaining exposure to a cryptocurrency without ownership, reducing the risk and cost of holding the asset. Other pros are a lower learning curve and higher security for investors since ETFs take charge of securing the underlying asset holdings. As for the main drawbacks, the main one is that as an investor you can’t have direct ownership of the asset, or, as they say in crypto, “not your keys, not your coins.” Other disadvantages are higher costs associated with holding crypto since ETFs charge fees for active management. Finally, even though investing in ETFs reduces the risk of holding an asset, price swings in the underlying cryptocurrency are likely to be reflected in the investment vehicle too.
추천 기사


