


Monero and Zcash Outlook: XMR and ZEC technical structure weakens
- The cryptocurrency market broadly erases recent gains as investors navigate a hawkish Fed stance.
- Monero looks poised to extend its decline amid growing risk-averse sentiment.
- Zcash remains vulnerable to further losses under the 50-day EMA, with technical factors dampening buying momentum.
Monero (XMR) and Zcash (ZEC) continue to slide on Thursday as prevailing bearish sentiment dominates the crypto market. XMR declines for a third straight day and remains under $330, reflecting sustained selling pressure. Similarly, ZEC faces persistent headwinds, with resistance holding firm below the $500 supply zone.
Monero and Zcash falter amid macroeconomic pressure
The broader crypto market remains under pressure following comments from Federal Reserve (Fed) Chairman Kevin Warsh in his first post-meeting press conference on Wednesday.
The Federal Open Market Committee (FOMC) left interest rates unchanged, meeting market expectations, but what spooked investors was the Fed’s hawkish stance, which favored price stability and the need to bring inflation down to the long-term target of 2%.
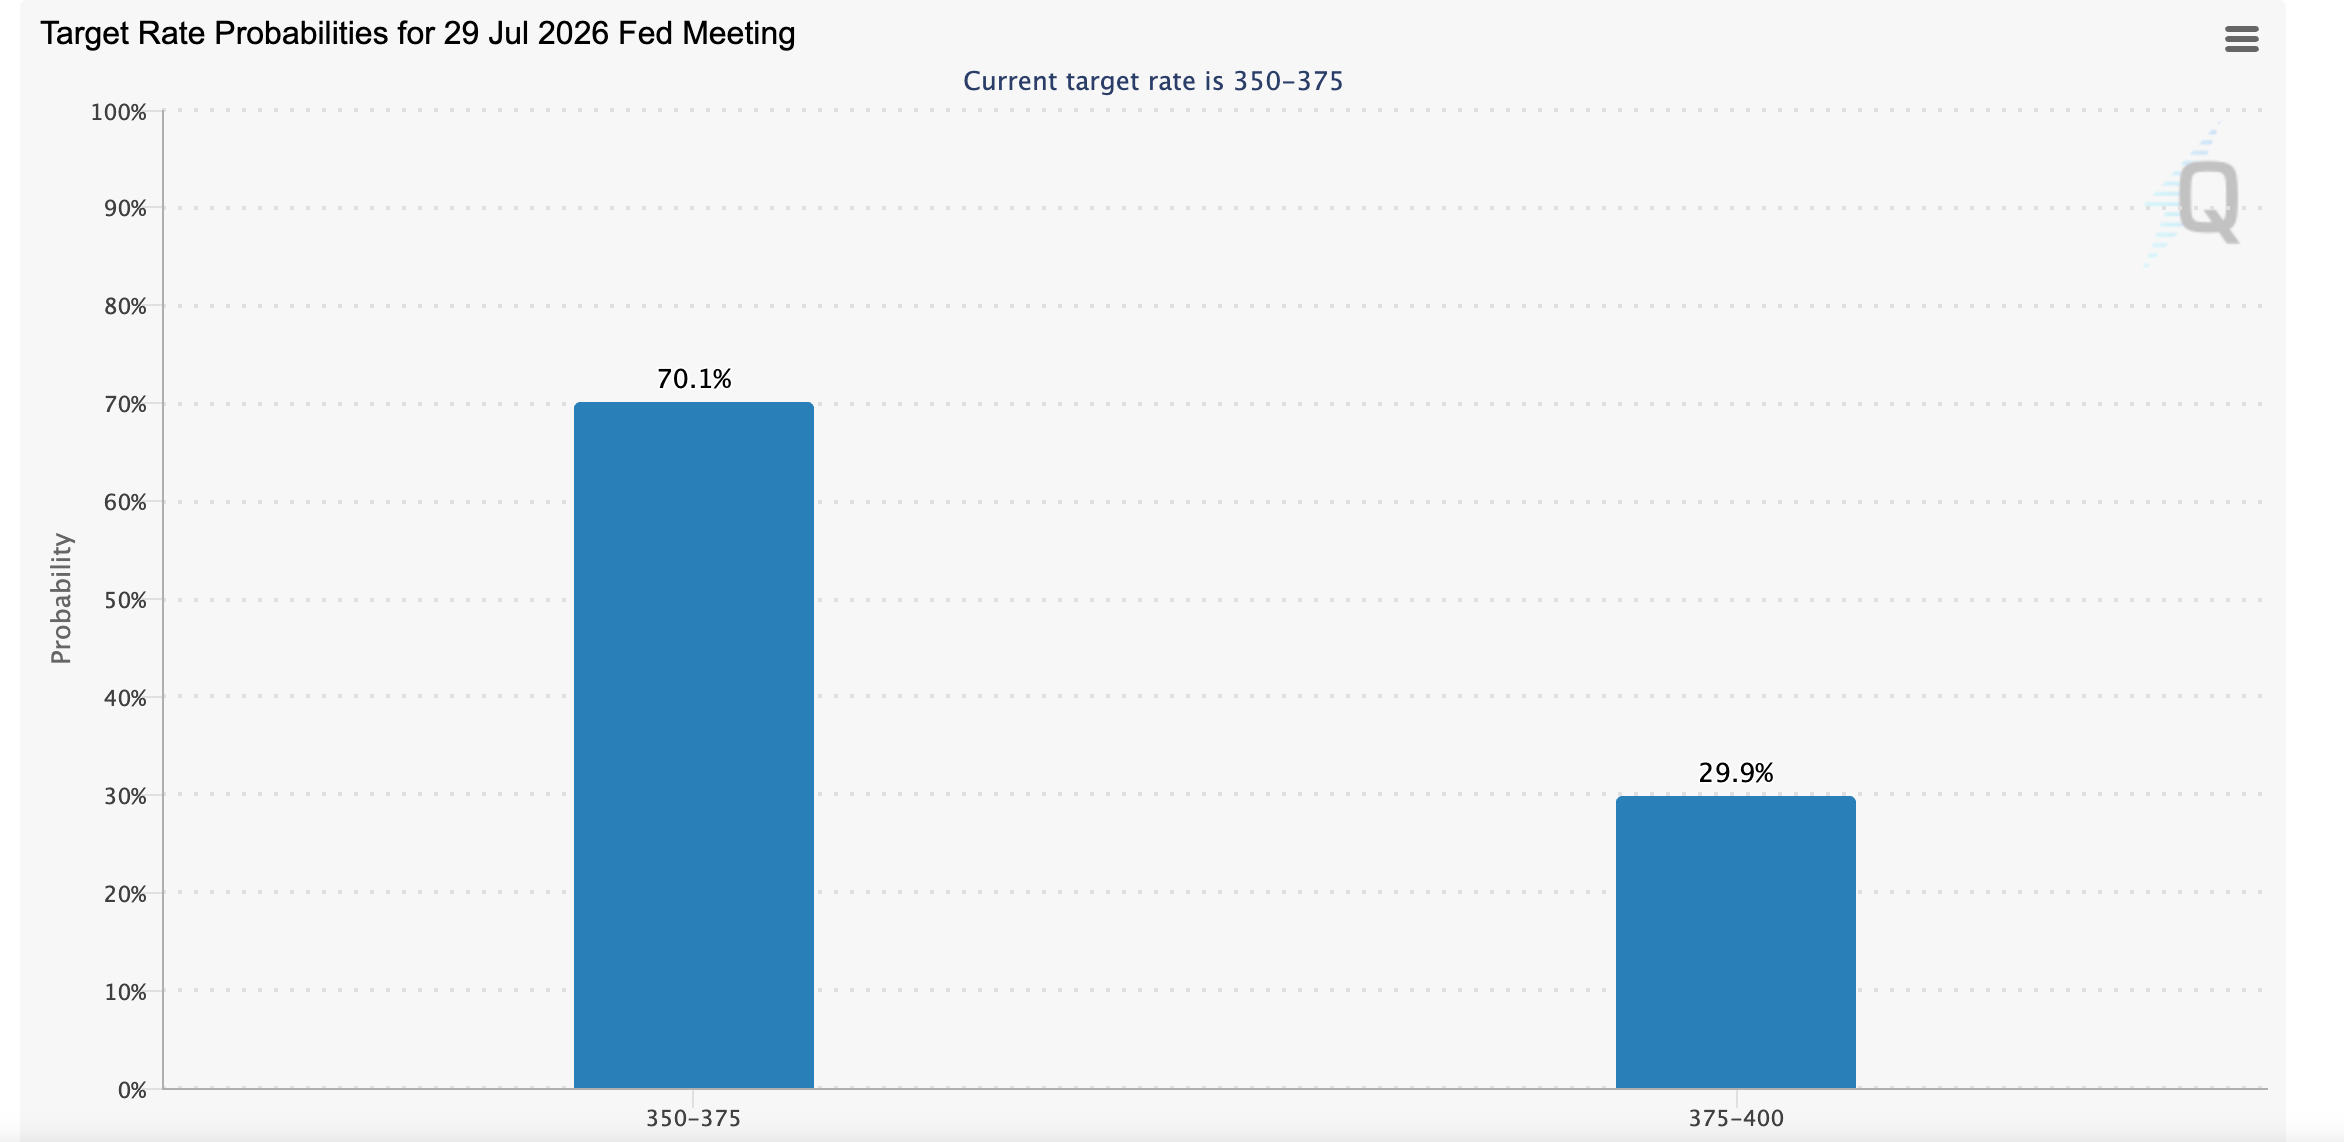
Warsh’s communication signaled a central bank seemingly comfortable with the current outlook but not yet ready to signal a pivot toward lower rates. In fact, the probability of a rate hike is back on the table, with market participants currently betting on a 30% chance in the next review.
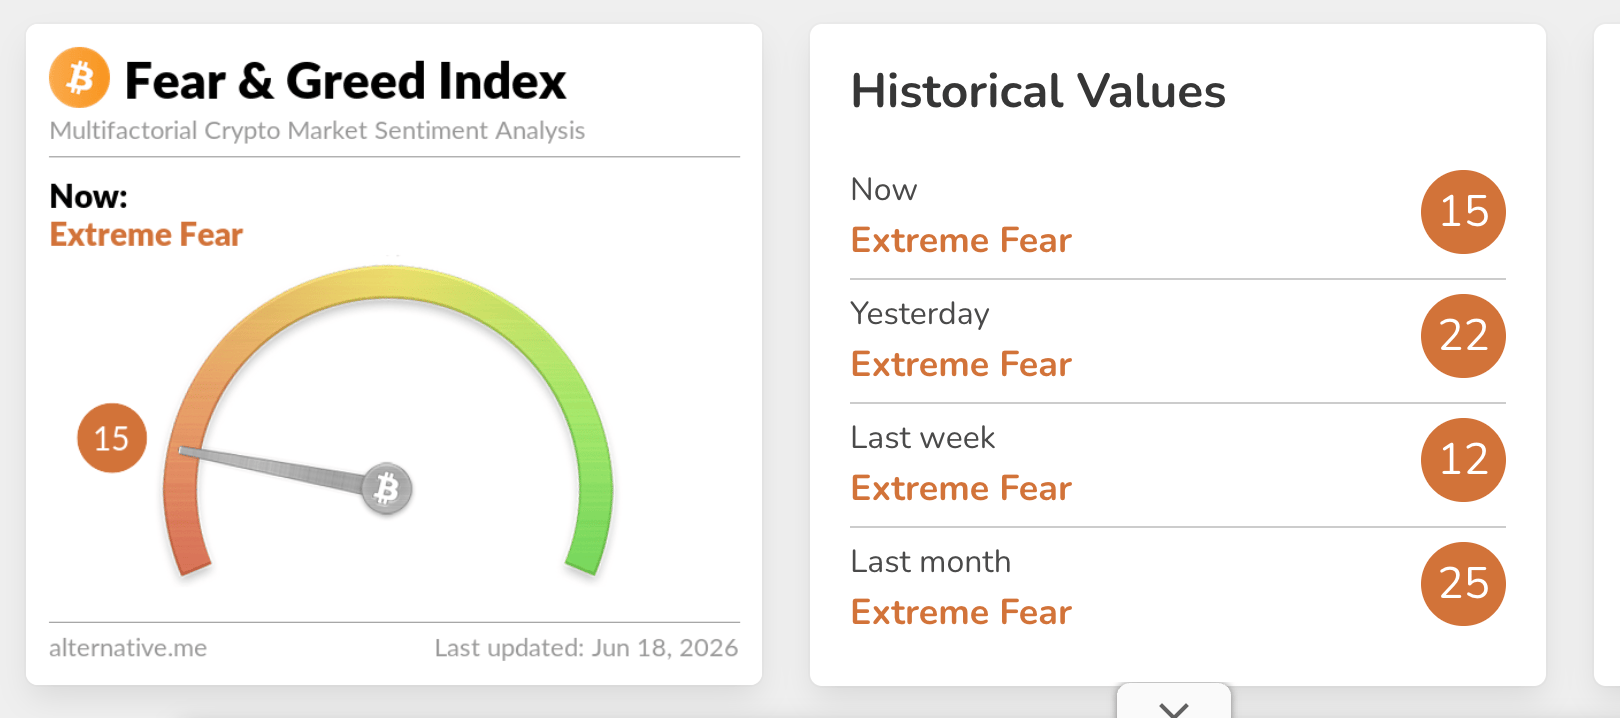
Sentiment softened further, as reflected in the Fear & Greed Index, which holds at 15 in the Extreme Fear territory on Thursday, down from 22 the day before. This shows that investors are cautious toward risk assets, with exposure likely to remain subdued in the short term.
Monero extends correction
XMR remains capped below the Bollinger middle band around $340 and all key Exponential Moving Averages, with the 50-day EMA near $359 and the 100-day and 200-day EMAs clustered just above $366.
Still, the positive Moving Average Convergence Divergence (MACD) histogram on the daily chart and a Money Flow Index (MFI) around 65 hint at improving upside momentum, but these oscillators only suggest that rebounds are corrective as long as spot remains under this dense overhead supply.
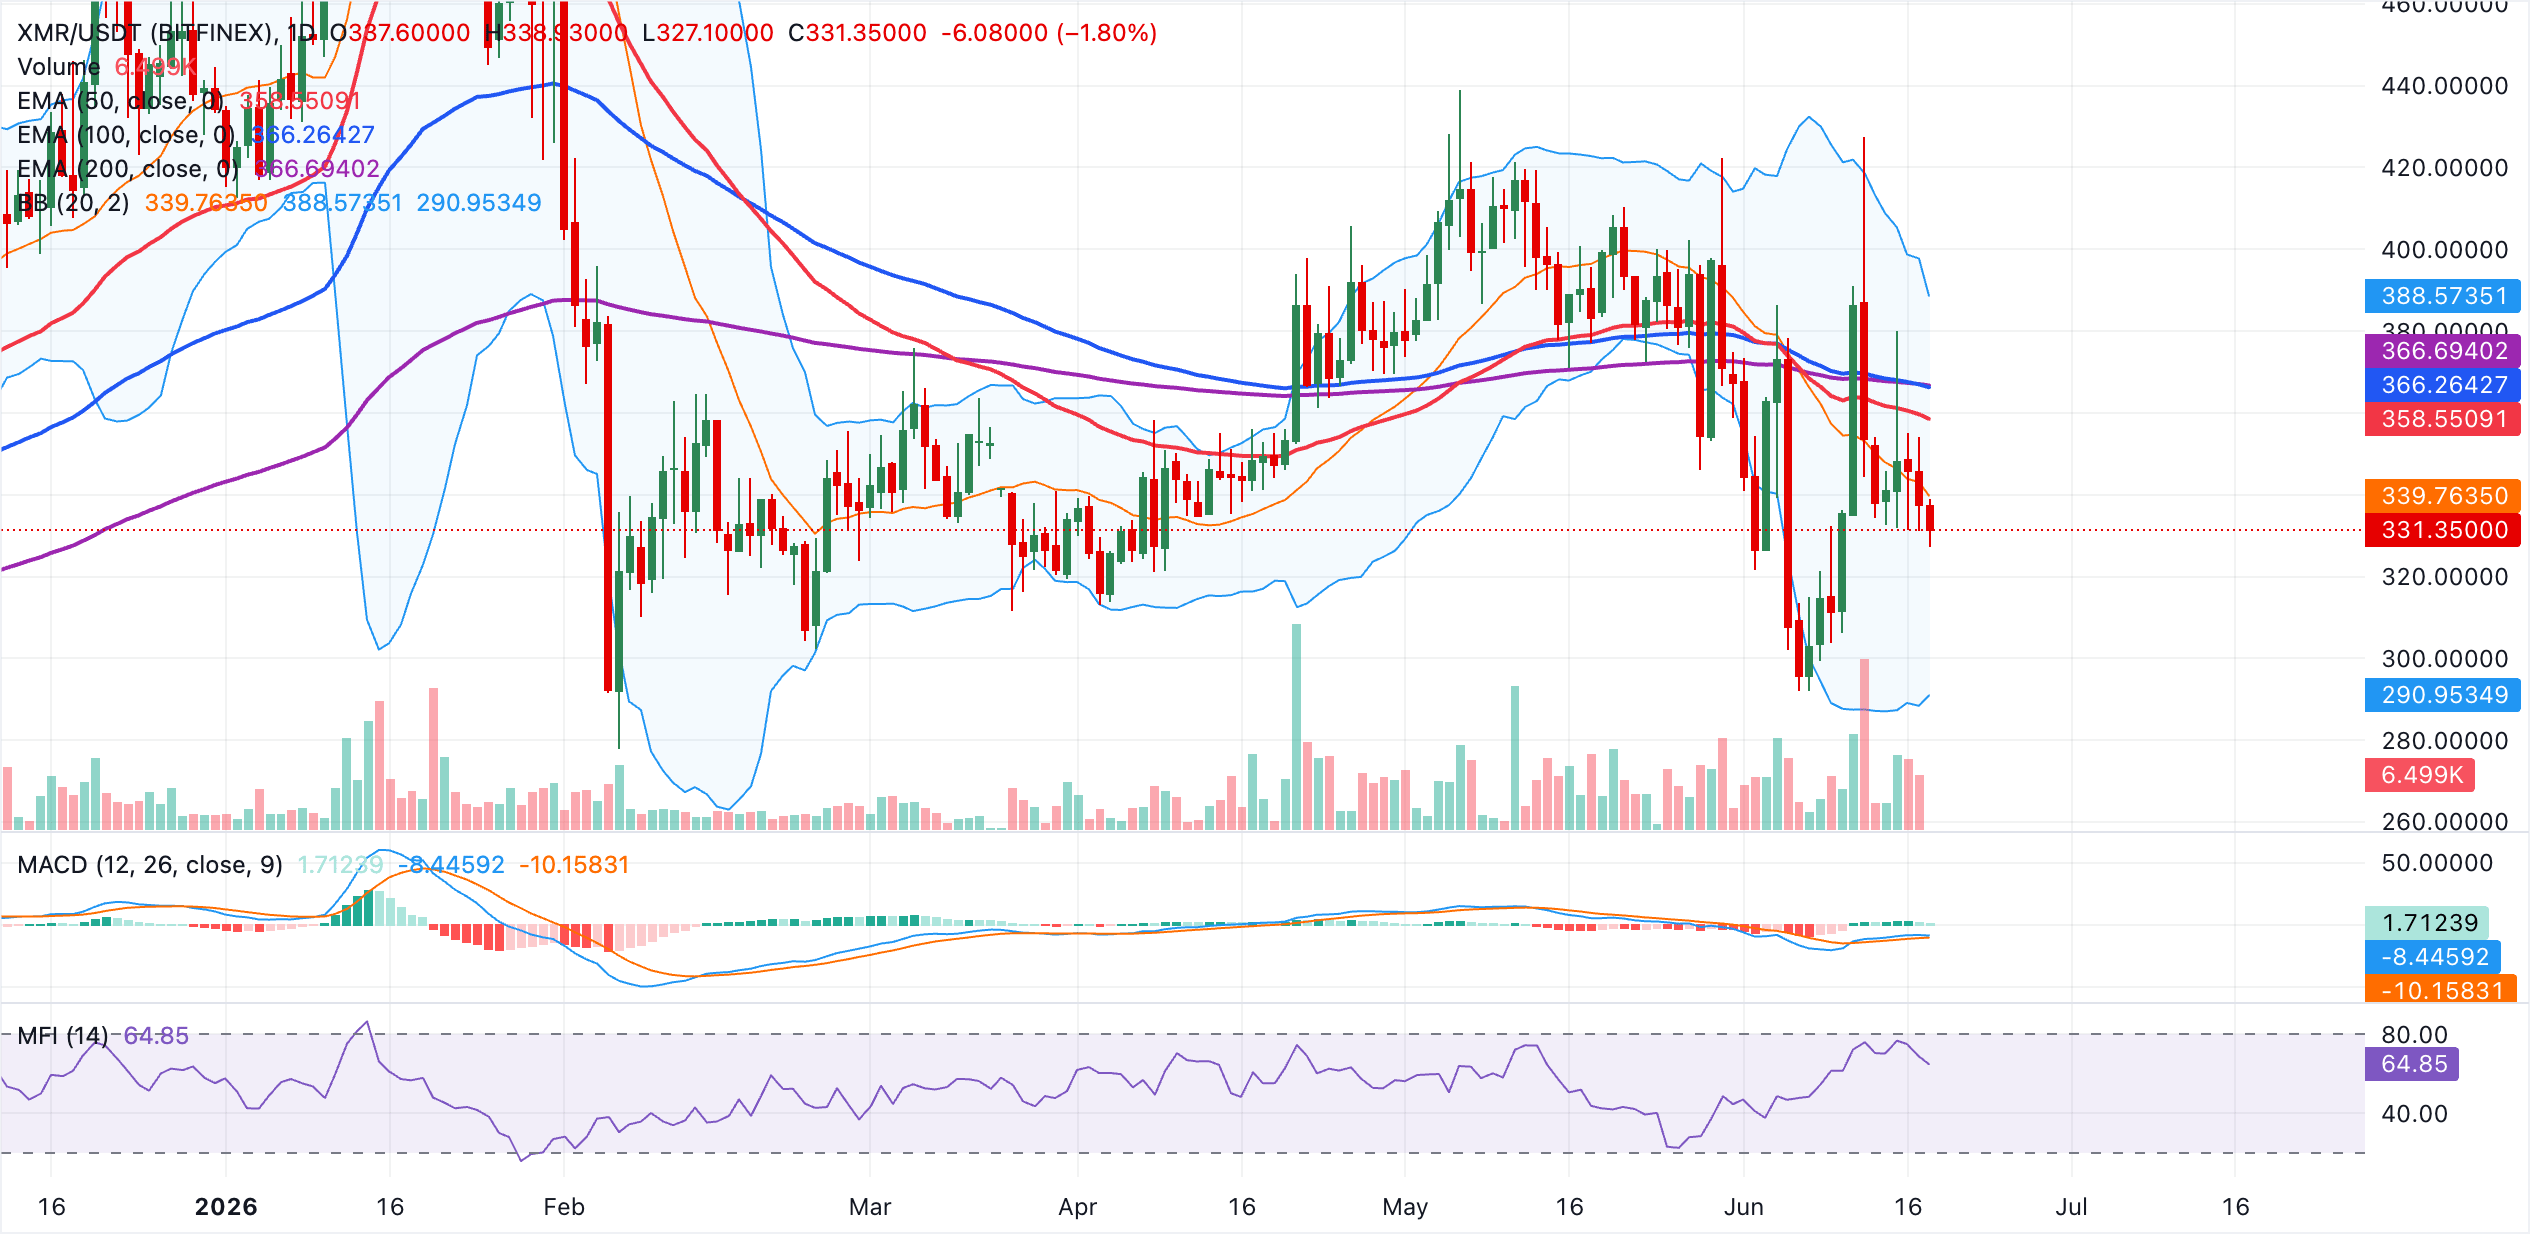
Meanwhile, initial resistance emerges at the Bollinger middle band near $340, followed by the 50-day EMA at roughly $359. Above that, the 100-day and 200-day EMAs around $367 form a broader barrier before the upper Bollinger band close to $389. On the downside, the lower Bollinger band near $291 acts as the next significant support. A break below this floor would open the door to a deeper retracement despite the currently constructive momentum backdrop.
Zcash losses deepen as bearish momentum builds
Zcash similarly remains pressured below the 50-day EMA at $477 after three consecutive days of declines. A daily close below this supply range could prompt more traders to de-risk, strengthening the bearish outlook toward the next key structural support near $430 and $376, respectively.
Conversely, the MACD histogram stays slightly positive on the daily chart, hinting that upside momentum is attempting to rebuild even as the MFI hovers around the mid-40s.
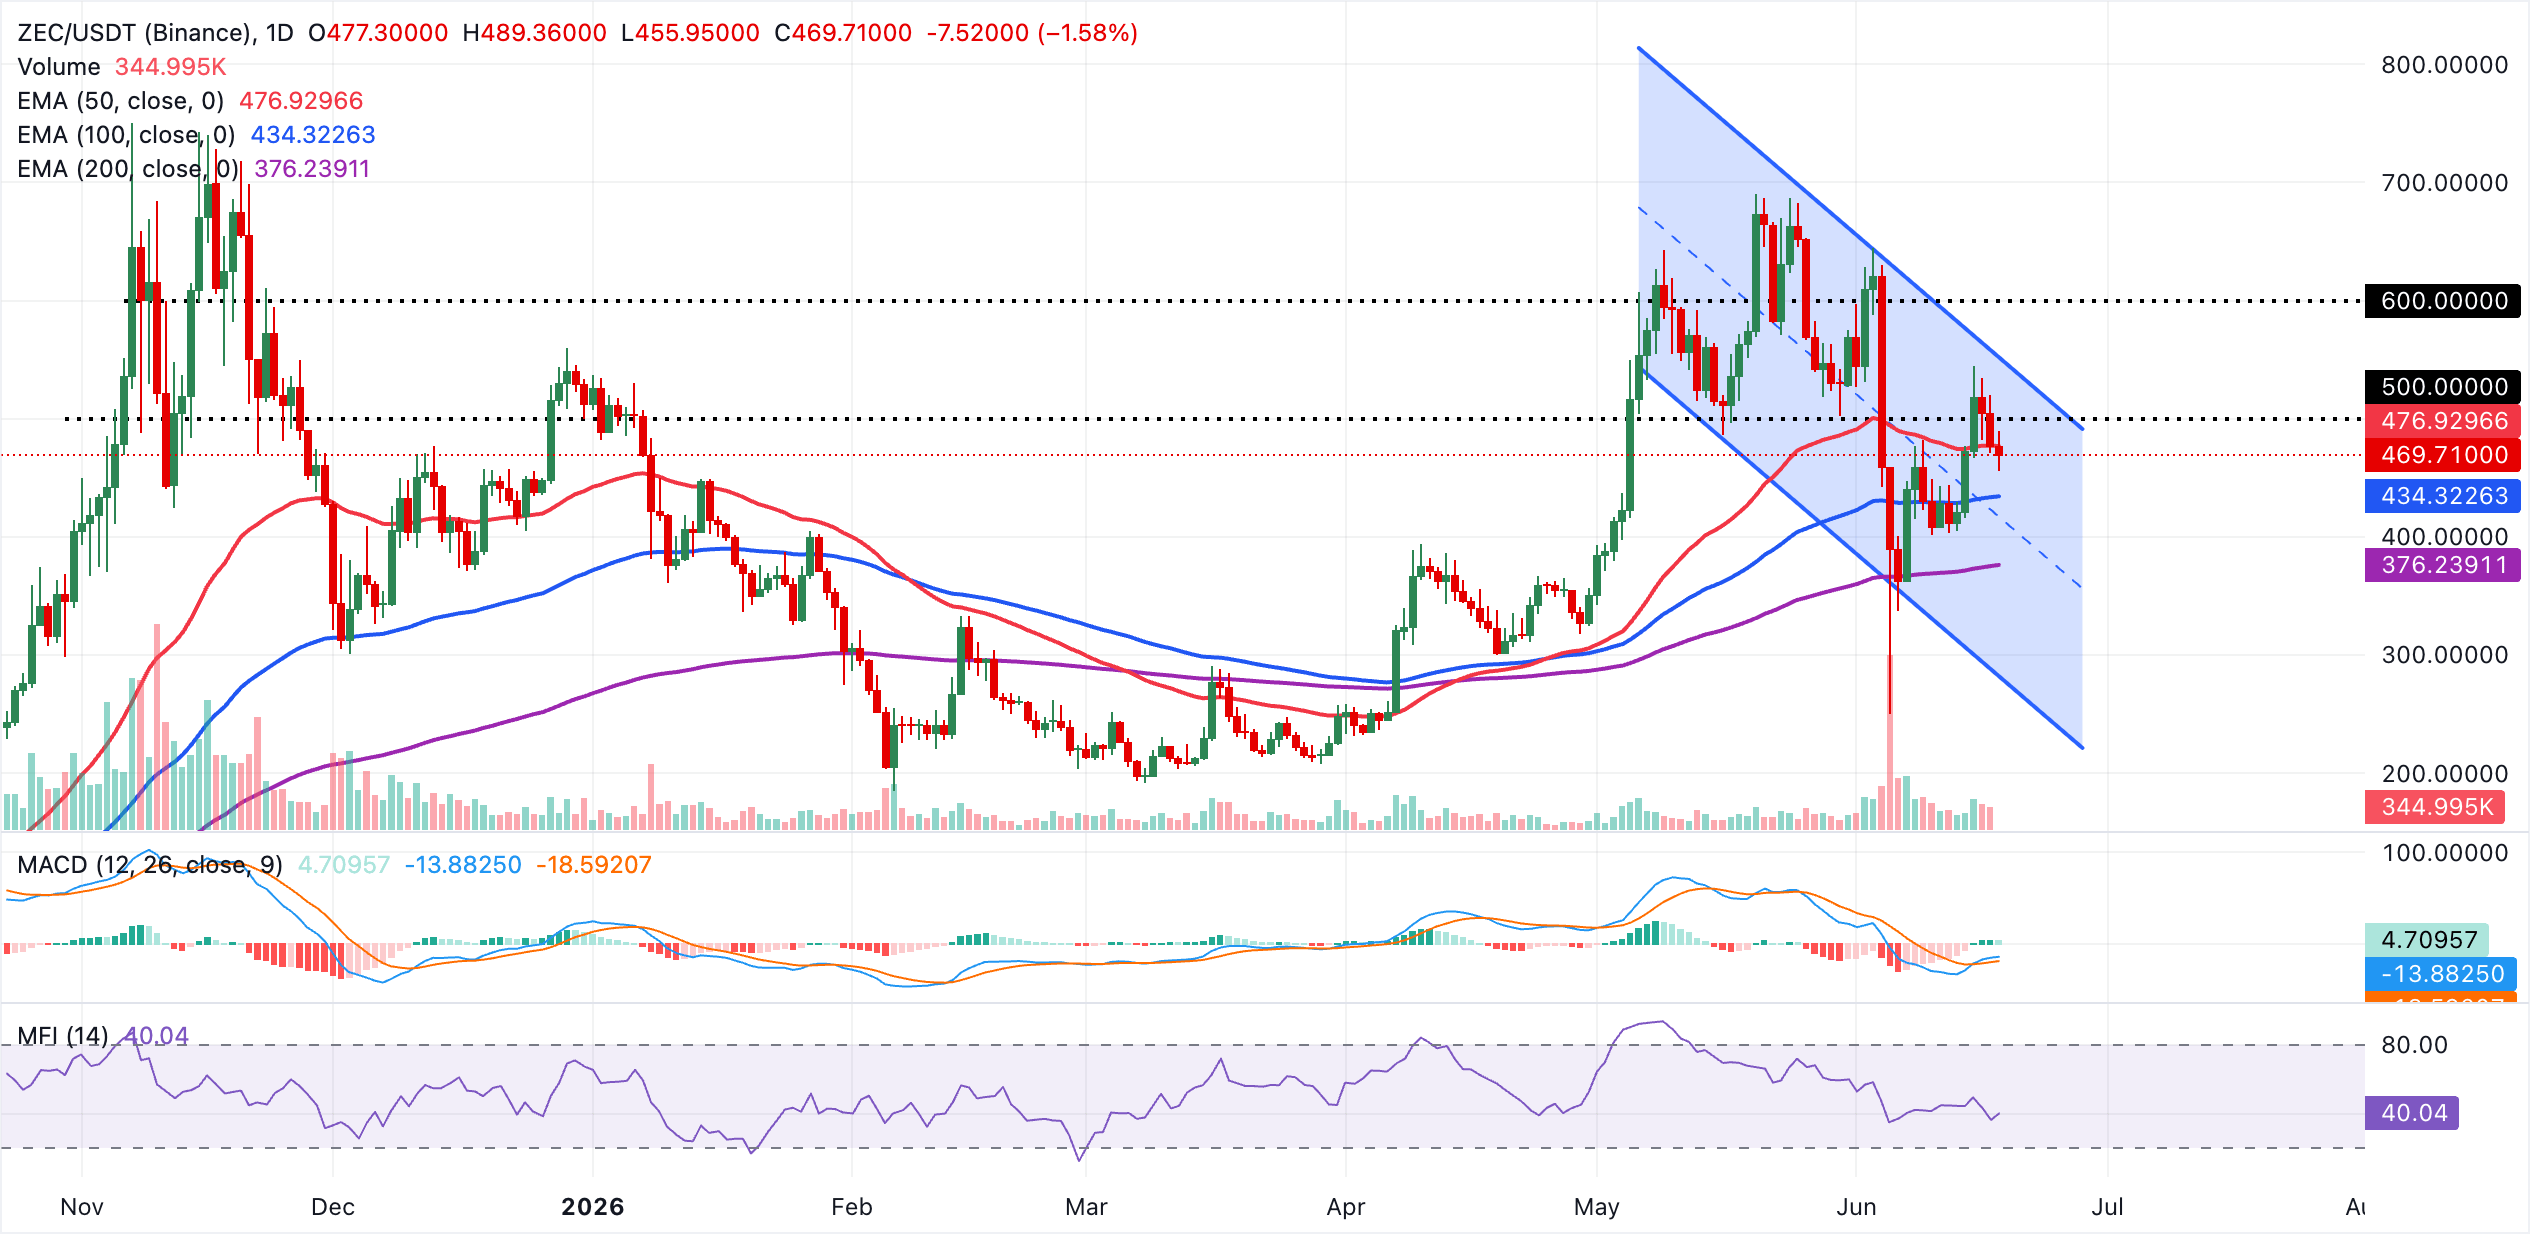
On the topside, initial resistance is defined by the 50-day EMA near $477, with the upper boundary of the descending channel around $549 acting as the next notable cap if buyers extend the rebound. Looking down, immediate support emerges at the 100-day EMA around $434, ahead of the 200-day EMA near $376, while the channel floor close to $279 marks a more distant but important medium-term demand zone should selling pressure resume.
(The technical analysis of this story was written with the help of an AI tool.)
Bitcoin, altcoins, stablecoins FAQs
Bitcoin is the largest cryptocurrency by market capitalization, a virtual currency designed to serve as money. This form of payment cannot be controlled by any one person, group, or entity, which eliminates the need for third-party participation during financial transactions.
Altcoins are any cryptocurrency apart from Bitcoin, but some also regard Ethereum as a non-altcoin because it is from these two cryptocurrencies that forking happens. If this is true, then Litecoin is the first altcoin, forked from the Bitcoin protocol and, therefore, an “improved” version of it.
Stablecoins are cryptocurrencies designed to have a stable price, with their value backed by a reserve of the asset it represents. To achieve this, the value of any one stablecoin is pegged to a commodity or financial instrument, such as the US Dollar (USD), with its supply regulated by an algorithm or demand. The main goal of stablecoins is to provide an on/off-ramp for investors willing to trade and invest in cryptocurrencies. Stablecoins also allow investors to store value since cryptocurrencies, in general, are subject to volatility.
Bitcoin dominance is the ratio of Bitcoin's market capitalization to the total market capitalization of all cryptocurrencies combined. It provides a clear picture of Bitcoin’s interest among investors. A high BTC dominance typically happens before and during a bull run, in which investors resort to investing in relatively stable and high market capitalization cryptocurrency like Bitcoin. A drop in BTC dominance usually means that investors are moving their capital and/or profits to altcoins in a quest for higher returns, which usually triggers an explosion of altcoin rallies.
추천 기사


