

Gold Prices Fall Below Key $4,500 Mark, US Treasury Yields Rise for Seventh Day, Gold May Fall to $4,100

- US President Donald Trump says trade will be priority in summit with Xi, not Iran
- Iran Situation Rekindles Threat of War. Bitcoin Price Decline Accelerates, $75,000 Geopolitical Defense Line Faces Test
- Gold edges higher to near $4,700 as Trump-Xi summit looms
- Inflation 'High Fever' Fails to Stop Rally? BTC Temporarily Loses 80,000 Mark, But Arthur Hayes Sees Peak of $126,000
- Euro softens to near 1.1600 on US–Iran tensions
- Australian Dollar softens to near 0.7200 as Trump and Xi set for second day of talks

TradingKey - On Tuesday (May 19), gold ( XAUUSD) closed at $4,481.89. The price confirmed a break below $4,500, further opening up the downside. On Wednesday, gold extended its downward trend from the previous day, hitting an intraday low of $4,460.
Inflationary Pressures Surge, Gold Prices Face Heavy Pressure
From a fundamental perspective, the most direct pressure for the current correction in gold stems from persistent U.S. inflationary pressures, which have significantly cooled expectations for Federal Reserve rate cuts. Following the hotter-than-expected April CPI and PPI readings, the market has begun to worry that energy-driven inflation will prompt the Fed to maintain a more hawkish stance, with the possibility of even a rate hike gradually increasing. Since gold is a non-yielding asset, higher yields increase the opportunity cost of holding it, which is the fundamental reason for its recent continuous pressure.
Meanwhile, uncertainty in U.S.-Iran relations has pushed oil prices higher, causing U.S. inflation expectations to continue heating up. Trump stated on Tuesday that the U.S. might need to strike Iran again, noting that he was once just an hour away from authorizing military action but chose to postpone it to allow time for negotiations; he also hinted that if negotiations yield no results, new strikes could occur within the next few days.
Additionally, a stronger U.S. dollar and rising Treasury yields have exerted further downward pressure on gold. Market charts show that the U.S. Dollar Index has rebounded continuously after retesting the 97.50 support level and is currently near 99.30. Simultaneously, the 10-year U.S. Treasury yield has risen for seven consecutive trading sessions, repeatedly hitting new year-to-date highs and currently maintaining a high level near 4.67%.
Key $4,500 support level breached, opening further downside for gold prices.
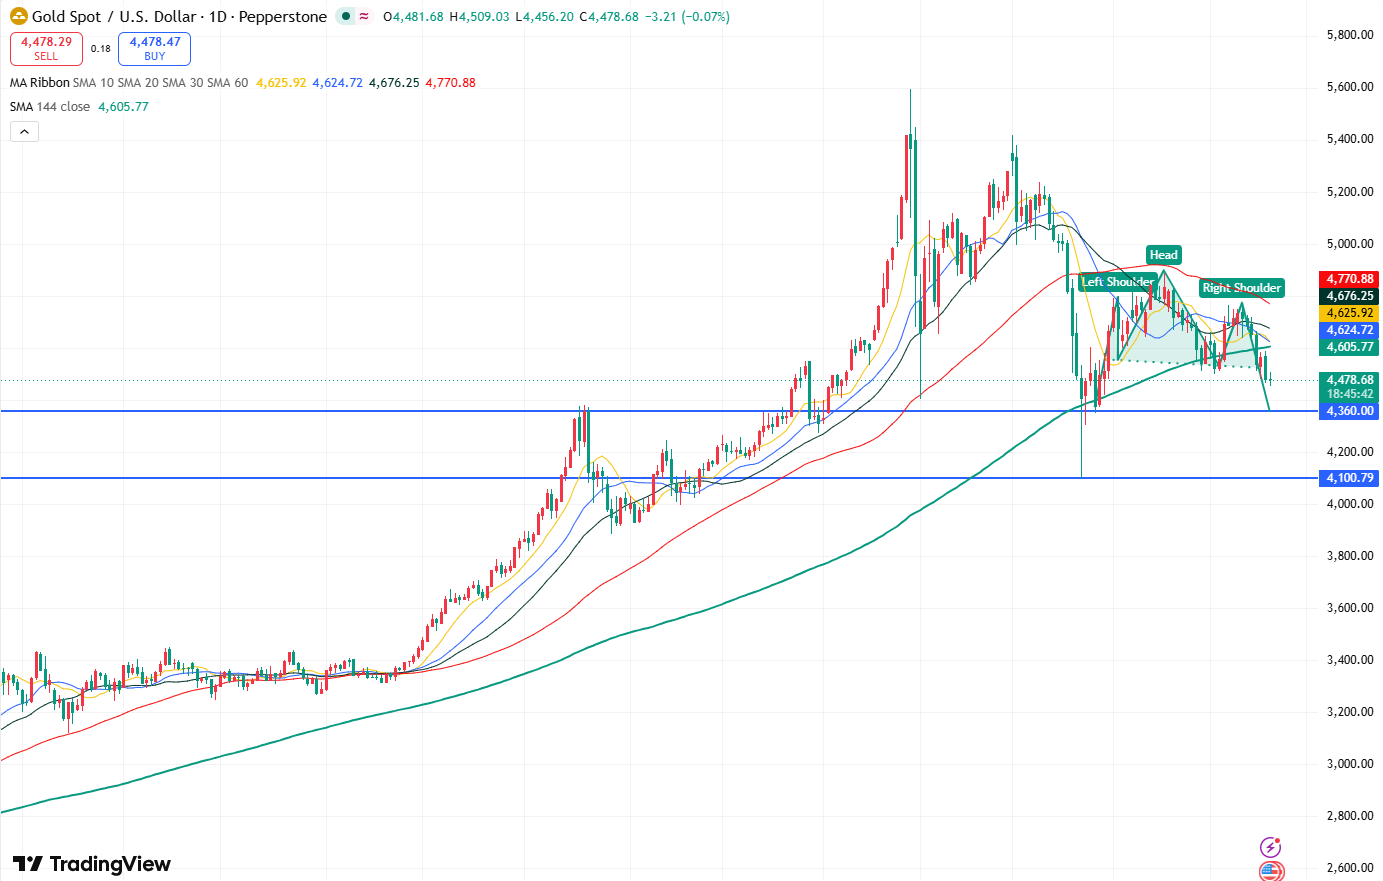
Gold price daily chart, Source: TradingView
According to the daily chart, gold's candlestick structure has formed a distinct head and shoulders top pattern, suggesting a bearish trend in the short term. Meanwhile, gold closed at $4,481.89 on Tuesday, confirming a breakdown of the key $4,500 support level, which further strengthens bearish momentum and indicates that gold may continue to fall in the near term.
Regarding technical indicators, the moving average system shows that the 10, 20, 30, and 60-day moving averages have all turned downward, signaling bearish market sentiment. Furthermore, the 10-day moving average has crossed below the 20 and 30-day moving averages, forming a death cross effect that significantly bolsters short-term bearish momentum.
The Relative Strength Index (RSI) is currently near 36; as gold has not yet entered overbought territory, this suggests that there is still room for further downside.
Currently, as gold has confirmed a breakdown below the $4,500 level, the downside path toward the major $4,360 support level has opened up. If gold continues to fall and decisively breaks below $4,360, the price may further decline to test the $4,100 support level.
Read more
* The content presented above, whether from a third party or not, is considered as general advice only. This article should not be construed as containing investment advice, investment recommendations, an offer of or solicitation for any transactions in financial instruments.


