


President Donald Trump Just Called Nov. 5 One of the Stock Market's "Worst Days in History" Due to Election Results -- but Warning Signs Have Been Apparent for Months
Key Points
A gubernatorial blue wave has put the artificial intelligence (AI) data center build-out on notice.
History shows that it’s not a matter of if, but of when, pricey stock markets falter.
The bond market has been sounding an alarm about the AI infrastructure build-out for some time.
- 10 stocks we like better than S&P 500 Index ›
Last Thursday, Nov. 5, was a day to remember on Wall Street. When the dust settled, the iconic Dow Jones Industrial Average (DJINDICES:^DJI), benchmark S&P 500 (SNPINDEX:^GSPC), and tech-powered Nasdaq Composite (NASDAQINDEX:^IXIC) had tumbled by 1,833 points, 335 points, and 1,422 points, respectively. The 1,422-point decline in the Nasdaq Composite is by far the largest in its 55-year history.
President Donald Trump took to social media to blame the Nov. 3 midterm elections for the stock market's poor performance:
Missed Nvidia in 2009? This Rare Signal Is Flashing Again. In 2009, a "Double Down" signal flashed for a little-known chipmaker called Nvidia. For the first time in years, that same "Total Conviction" signal is flashing for a company 1/100th the size of Nvidia. Continue »
The stock market suffered one of the worst days in history based on the results of the election. Such a sad thing to watch!

President Trump blames the election results for the stock market's tumble, but he's not entirely correct. Image source: Official White House Photo.
While some aspects of Thursday's stock market plunge can be tied to midterm elections, President Trump's statement overlooks several equity market warning signs, which have been apparent for months.
A gubernatorial blue wave compromises the AI data center build-out
Arguably, the biggest concern for Wall Street is the blue wave observed at the gubernatorial level. Democratic candidates flipped five Republican governorships, three of which (Texas, Georgia, and Ohio) are in states paramount to the artificial intelligence (AI) data center build-out.
BREAKING: President Trump releases a statement on today’s stock market crash. Trump calls today one of the market’s “worst days in history.” https://t.co/qobQdhCqut
— The Kobeissi Letter (@KobeissiLetter) November 5, 2026
Although President Trump has said he'll become "Mr. Veto" and use his presidential powers to stop a Democrat-led Congress from passing major legislation, including stricter AI regulations, his veto holds no power at the state level.
Texas Governor-elect Gina Hinojosa has promised to ban data center approvals until her state's legislature passes laws concerning electricity, water, and air rights. State-level regulation could put a serious dent in AI growth rates in key states.
This is the second-priciest stock market in 156 years
But the Nov. 5 plunge is about much more than just election results. For instance, the stock market entered 2026 at its second-highest valuation in 156 years.
Stock Market Shiller PE Ratio on the verge of taking out its Dot Com Bubble all-time high 🚨 🤯 👀 https://t.co/CtCmSgWnLt
— Barchart (@Barchart) July 11, 2026
In early June, the S&P 500's Shiller Price-to-Earnings (P/E) Ratio, also known as the Cyclically Adjusted P/E Ratio (CAPE Ratio), peaked at 42.84. For context, its backtested average multiple since January 1871 is 17.45.
Over the last 100 years, the Shiller P/E Ratio has exceeded 30 on six occasions, the previous five of which were all followed by declines in the Dow, S&P 500, and/or Nasdaq Composite of 20% to 89%. History shows that premium valuations aren't sustainable -- even with an addressable market as large as AI.
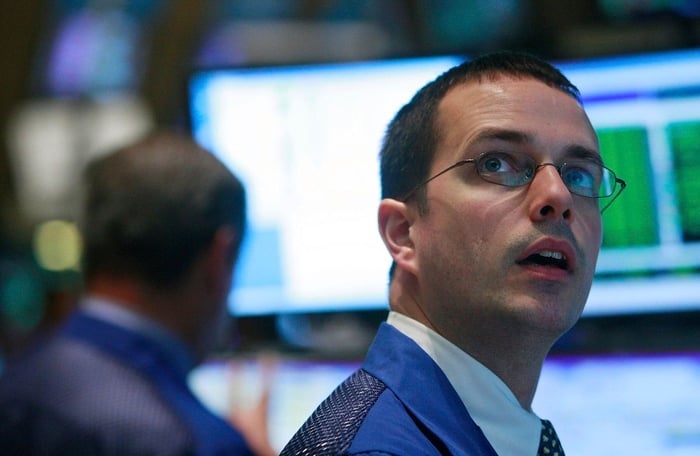
Image source: Getty Images.
The bond market is sounding an alarm
Furthermore, the bond market was sounding a warning about the AI infrastructure build-out long before midterm elections took place.
Though some companies are using cash on hand or share issuances to fund their data center expansion, several businesses have turned to debt offerings. Public companies typically issue debt at a par value of $1,000 (expressed as $1 on most financial sites). For months, the bond prices of several AI companies have plunged, thereby boosting their yields:
- CoreWeave's (NASDAQ:CRWV) 2031 note (issued earlier this year) is trading at $0.78
- Nvidia's (NASDAQ:NVDA) 2060 note is trading at $0.63
- Space Exploration Technologies' (NASDAQ:SPCX) 2056 note (issued in June) is trading at $0.83
The bond market sees serious risks with the AI data center build-out, and underlying debt is being repriced accordingly.
One of Wall Street's "worst days in history" is about much more than just midterm elections.
Should you buy stock in S&P 500 Index right now?
Before you buy stock in S&P 500 Index, consider this:
The Motley Fool Stock Advisor analyst team just identified what they believe are the 10 best stocks for investors to buy now… and S&P 500 Index wasn’t one of them. The 10 stocks that made the cut could produce monster returns in the coming years.
Consider when Netflix made this list on December 17, 2004... if you invested $1,000 at the time of our recommendation, you’d have $341,966!* Or when Nvidia made this list on April 15, 2005... if you invested $1,000 at the time of our recommendation, you’d have $1,146,819!*
Now, it’s worth noting Stock Advisor’s total average return is 852% — a market-crushing outperformance compared to 203% for the S&P 500. Don't miss the latest top 10 list, available with Stock Advisor, and join an investing community built by individual investors for individual investors.
See the 10 stocks »
*Stock Advisor returns as of November 9, 2026.
Sean Williams has no position in any of the stocks mentioned. The Motley Fool has positions in and recommends Nvidia. The Motley Fool recommends Space Exploration Technologies. The Motley Fool has a disclosure policy.
Recommended Articles


