

XRP Severely Underperforms Bitcoin as Monthly Plunge Exceeds 20%, Threatening $1 Mark

Source Tradingkey

TradingKey - XRP has severely underperformed Bitcoin, plunging more than 20% in a single month and risking further declines below the key $1 level.

On November 9, Ripple (XRP) suffered a fifth consecutive day of declines, sliding over 6% today to widen its one-month drop to more than 20%, far outpacing Bitcoin's 9% decline over the same period. XRP has now lost the $1.10 level, sinking to $1.0847 to hit a fresh three-month low. As technical support breaks down, the market is closely watching whether XRP will decisively break below the key $1 psychological threshold.

Over the prior two months, Ripple fluctuated at elevated levels between $1.20 and $1.70. However, the outcome of the U.S. midterm elections broke this range-bound pattern. On November 5, after briefly rebounding above $1.30, XRP retreated rapidly and broke below strong support at $1.20, continuing its downward slide thereafter.

Following the Democrats' sweep of both the Senate and the House of Representatives, the market widely expects that the legislative process for the Clarity Act—previously viewed as favorable to the crypto industry and cross-border payments—will be forced to stall or undergo significant revisions. Concerns that an SEC-led new regulatory regime will impose tighter rules on cross-border payment tokens, DeFi yields, and institutional custody have dampened the macro narrative surrounding Ripple's expansion within the U.S. institutional payment ecosystem.

Currently, XRP is fighting a critical short-term battle to defend the psychological $1.00 level. If Bitcoin can stabilize around $75,000, XRP could find strong spot buying support at the $1.00 mark and subsequently consolidate within a $1.00–$1.38 range for several quarters. Conversely, if Bitcoin breaks below its four-month key support at $75,000, it is expected to extend its decline, which could drag XRP down further to test the $1 level.
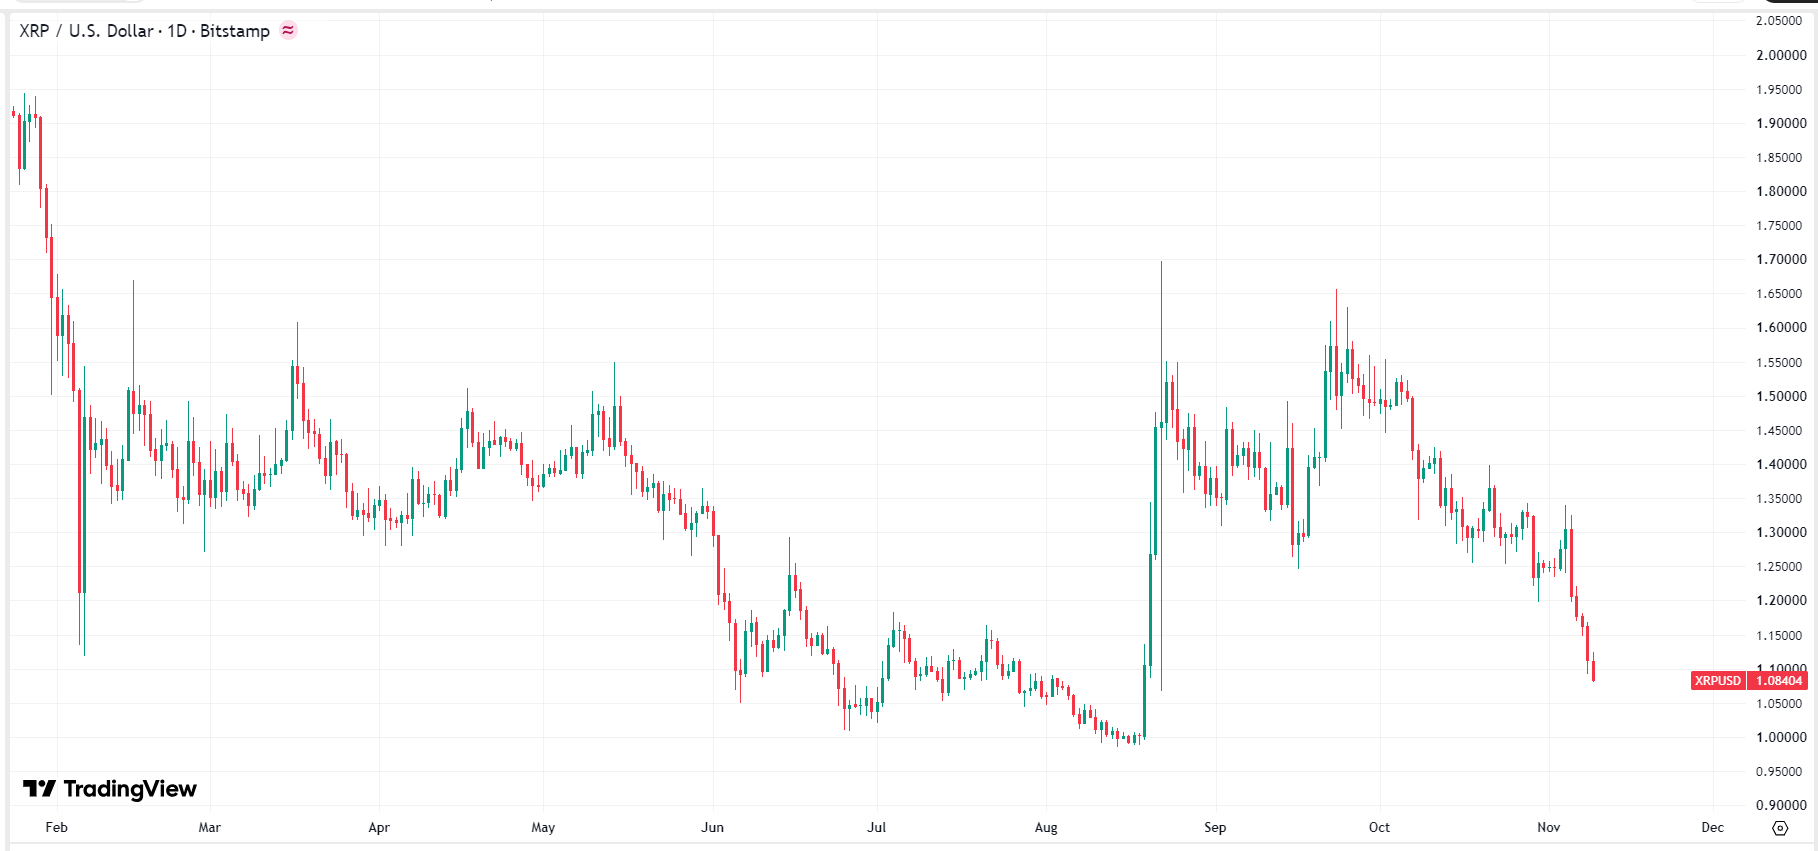
xrp-price-fb4a8958b4ec480f954aad93cef3cea1XRP price chart, Source: TradingView

With the U.S. scheduled to release CPI and PPI data this week, if inflation fails to cool and lingering risk-off sentiment triggers a decisive break below the $1.00 mark, it could spark technical stop-loss selling and leveraged liquidations, driving prices further toward the August low near $0.98 in search of deeper valuation support.

Disclaimer: For information purposes only. Past performance is not indicative of future results.
placeholder
TradingKey Daily Market Brief: Nasdaq Falls Over 5%, AI Stocks Plunge as Nvidia Drops Over 9%, Micron Falls Over 17%, SanDisk Drops Over 22% During the Asian trading session on November 6, the three major U.S. stock indices tumbled across the board overnight as the sell-off across the AI data center suppl
Author  TradingKey
Nov 06, Fri
During the Asian trading session on November 6, the three major U.S. stock indices tumbled across the board overnight as the sell-off across the AI data center suppl
placeholder
Gold Price Analysis Today | Forex Gold Analysis | XAU/USD Analysis - November 6, 2026Get the latest gold price analysis, forex gold insights, and XAU/USD analysis for November 6, 2026. Read on for the details.
Author  Mitrade
Nov 06, Fri
Get the latest gold price analysis, forex gold insights, and XAU/USD analysis for November 6, 2026. Read on for the details.
placeholder
Micron's $4.5 billion Taiwan fab won't make a chip until 2028 — the market sold it as a 2026 problemMicron fell 17.46% to $656.39 after Bloomberg reported construction at its $4.5 billion Taoyuan Fab 11E had all but halted over a labor dispute. The plant was not due online until 2028, so no 2026 output is lost. With FY27 EPS consensus near $160 and 2027 HBM sold out, the selloff is a peak-cycle multiple reset, not a demand collapse — and $650 is the line that separates the two.
Author  Irene Q.
Nov 06, Fri
Micron fell 17.46% to $656.39 after Bloomberg reported construction at its $4.5 billion Taoyuan Fab 11E had all but halted over a labor dispute. The plant was not due online until 2028, so no 2026 output is lost. With FY27 EPS consensus near $160 and 2027 HBM sold out, the selloff is a peak-cycle multiple reset, not a demand collapse — and $650 is the line that separates the two.
placeholder
Gold Price Analysis Today | Forex Gold Analysis | XAU/USD Analysis - November 9, 2026Get the latest gold price analysis, forex gold insights, and XAU/USD analysis for November 9, 2026. Read on for the details.
Author  Mitrade
7 hours ago
Get the latest gold price analysis, forex gold insights, and XAU/USD analysis for November 9, 2026. Read on for the details.
placeholder
Bitcoin ETFs sold $1.28 billion in a week — and BTC is still above 75,000US spot Bitcoin ETFs logged $1.28 billion of net outflows in the week to Nov 6, the largest since late June, with BlackRock's IBIT accounting for $1.21 billion. Yet BTC only fell from $80,405 to $74,940, a 6.8% move. The gap between the fund flow and the price is the story: leveraged longs were flushed, but spot holders did not follow the ETFs out — and $75,000 is the line that decides whether that reading holds.
Author  Suzie
6 hours ago
US spot Bitcoin ETFs logged $1.28 billion of net outflows in the week to Nov 6, the largest since late June, with BlackRock's IBIT accounting for $1.21 billion. Yet BTC only fell from $80,405 to $74,940, a 6.8% move. The gap between the fund flow and the price is the story: leveraged longs were flushed, but spot holders did not follow the ETFs out — and $75,000 is the line that decides whether that reading holds.
goTop
quote