


Nvidia Board Inquiry Puts $177.92 Support in Focus Ahead of Earnings
TradingKey - Nvidia (NASDAQ: NVDA) closed Friday, November 6, at $186.64, up 2.78%. The weekend changed what traders face on Monday. Nvidia’s board opened an independent inquiry into reports that a foreign intelligence effort targeted CEO Jensen Huang. Shares traded around $180.30 outside regular hours, according to Reuters, bringing $177.92 support into play.
The November 17 earnings report gives shareholders a separate test. Nvidia has committed billions of dollars to secure components. How quickly customers can install those systems and pay for them matters even if orders keep growing.
What the Board Has Said About Huang
Independent directors will oversee the inquiry with outside counsel. In its November 8 statement, the board backed Huang and his leadership team, said he would cooperate and said it had no reason to believe the matter had compromised national security or Nvidia’s secrets. Those are the board’s initial assessments. The investigation is still open.
The commercial question is whether customers change deployment plans. South Korea said it expected contracted GPU supplies to proceed, Reuters reported. That is an early indication from one market. A customer postponing a delivery or a change in who runs Nvidia would carry more weight for my earnings view than the overnight price move alone.
Investment Gains Lifted Reported Earnings
Data Center generated $89 billion of Nvidia’s $96.2 billion in fiscal second-quarter sales. The business more than doubled its revenue year over year. That leaves the timing of a relatively small number of large installations capable of moving the quarterly result.
Reported diluted EPS reached $2.46, against $2.22 on an adjusted basis. Nvidia recorded $7.77 billion in net gains on equity securities. Investors comparing chip profitability across quarters have a cleaner starting point in gross margin, which reached 75% on both a reported and an adjusted basis.
Nvidia Has Committed to Supply Before It Collects
The quarterly filing shows $279 billion of supply and capacity commitments at July 26, up from $119 billion one quarter earlier. These figures describe what Nvidia has agreed to procure. They tell shareholders little about when a customer will have the power, cooling and financing to take delivery.
A separate agreement illustrates how far Nvidia’s exposure extends. The company agreed to guarantee certain obligations for an Ohio campus that will host its equipment under leases to OpenAI. The guarantees carry a combined $105 billion cap and take effect in stages as facilities enter service, beginning as early as fiscal 2029. For shareholders, the schedule matters as much as the ceiling.
Korean Partnership Extends Nvidia’s Reach
On November 8, Nvidia, Rebellions and SK Telecom announced plans to connect Korean-designed AI processors to systems built around Nvidia’s networking technology. That gives Nvidia a route into installations where a customer chooses another company’s chip to run AI models. I would look for deployments and equipment sales before assigning earnings to the partnership.
What November 17 Needs to Show
Nvidia guided to $108 billion in quarterly revenue, plus or minus 2%, with gross margin around 74%, half a percentage point either way. Its outlook assumes zero Data Center compute revenue from China. A result near the midpoint would therefore tell investors more about demand elsewhere than about the prospects for Chinese approvals.
Cash is the second test. Nvidia generated about $21.3 billion in free cash flow last quarter and returned about $26 billion through dividends and buybacks. On the November 17 call at 5 p.m. Eastern, I’ll be listening for whether customers are taking delivery on schedule and whether collections are keeping up with sales.
NVDA Technical Analysis: The Failed $190.50 Retest
Friday’s rebound looks weaker than the 2.78% gain suggests. Buyers pushed Nvidia to $194.90 after the break below its rising trendline, then gave up $190.50 and closed at $186.64. What catches my attention is where buyers lost control. They had enough momentum to push through former support during the session, yet sellers regained that level before the close.
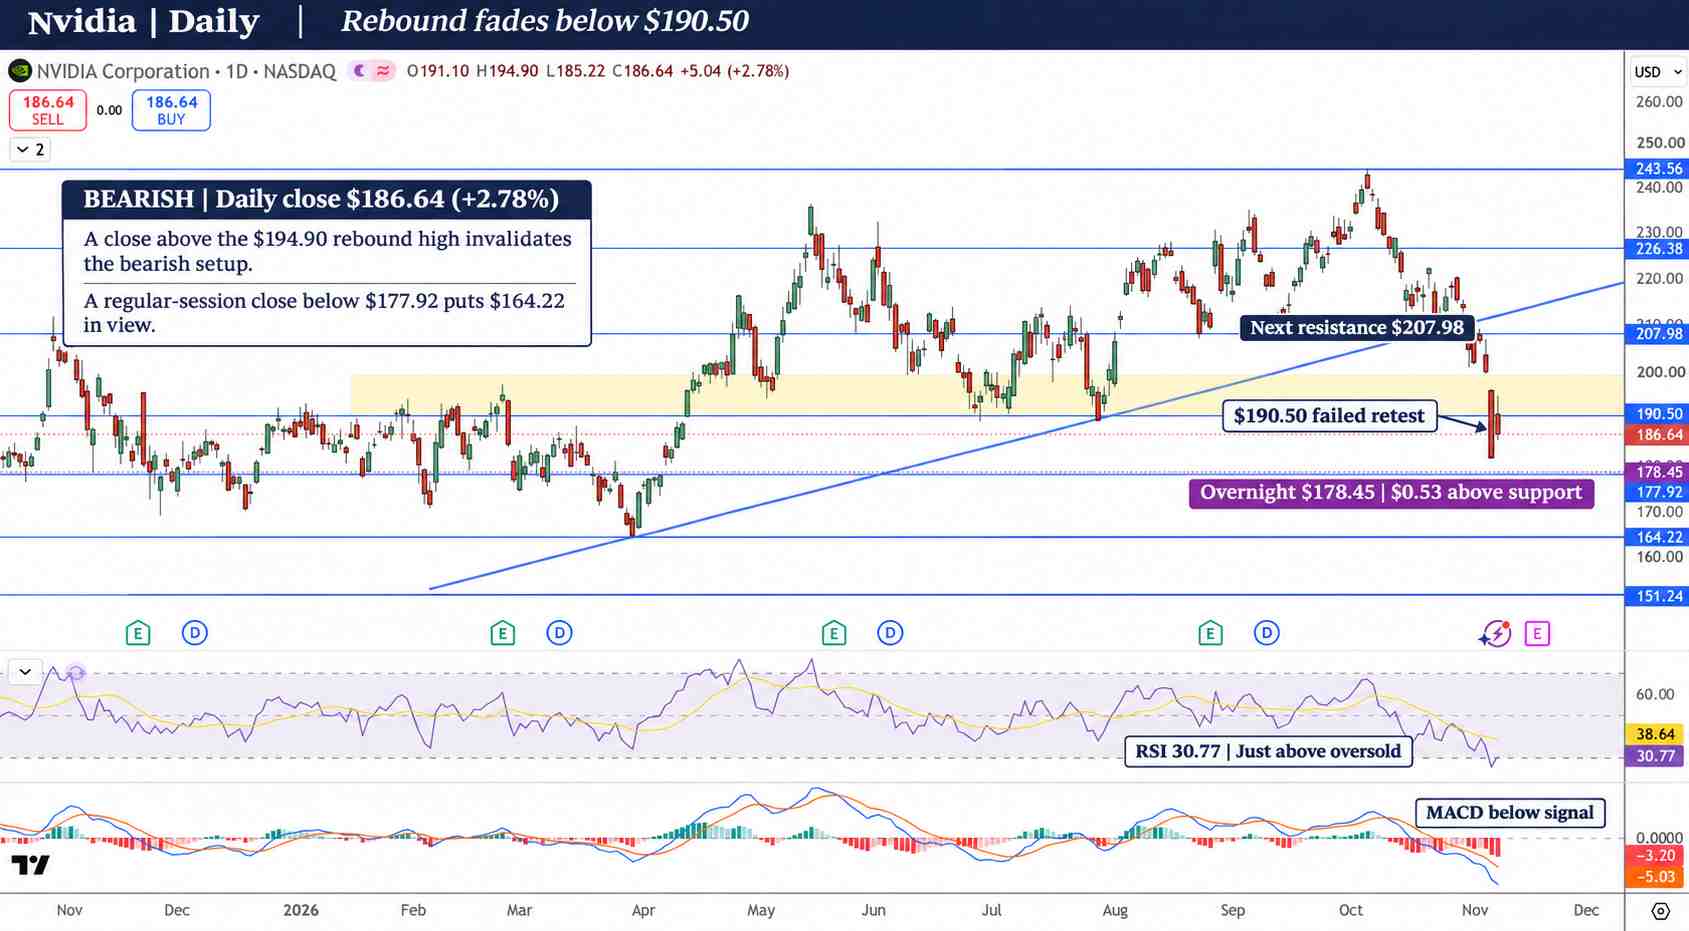
Nvidia Price Chart - Source: Tradingview
I remain bearish below the rebound high. The daily RSI of 30 is approaching oversold territory, and MACD remains below its signal line. That leaves room for a sharp bounce even while the trend is weak. At $177.92, I want to see where regular trading finishes. A brief dip through support followed by a recovery would give me little reason to extend the downside target. A daily close below it would bring $164.22 into view. On a rebound, $190.50 is the first hurdle. A close above $194.90 would overturn my bearish call and put $207.98 in play.
Key Levels
- Latest completed close: $186.64 on November 6
- Immediate resistance: $190.50
- Upside levels: $194.90, then $207.98
- Immediate support: $177.92
- Downside target: $164.22
- Daily RSI: 30, approaching oversold
FAQ
Has Nvidia changed its outlook since announcing the inquiry?
The board’s announcement addressed the review and its confidence in management. Nvidia’s published revenue outlook for the quarter remains $108 billion, plus or minus 2%.
What would signal that NVDA’s rebound has traction?
Holding above $190.50 would recover former support. A daily close above Friday’s $194.90 high would give buyers the stronger confirmation.
Bottom Line
Nvidia’s chip business enters earnings with strong demand. My concern is the cost of securing supply if customers delay installations. The board inquiry adds uncertainty around leadership, while deliveries, margins and collections will decide the earnings case. On the chart, I stay bearish until a daily close above $194.90.
Recommended Articles


