


TSMC Stock Forecast: Record AI Quarter Fails to Lift TSM as Shares Defend $412 Support
TradingKey - Taiwan Semiconductor Manufacturing (NYSE: TSM) results were reported this week. The stock is off its highs. However, 3Q of 26 was TSMC's best quarter ever. TSMC is the largest semiconductor manufacturer and foundry in the world. The American Depositary Receipt (ADR) closed on Thursday, October 15, at $422.25, down 2% on the results. TSM is currently trading down around 13% from its October high of $487.47, which is also its 52-week-high.
I believe TSMC is growing capex and AI demand is driving TSMC's recent growth. TSMC beat estimates and raised its 2026 guidance. TSMC guided 4Q26 significantly higher. The next catalyst is October monthly revenue. Historically TSMC has released its monthly revenue around November 10th.
A Clean Beat on Revenue and Earnings
TSMC's 3Q of 26 revenue was $46.72 billion, up 41.2% from a year earlier and 16.2% from the previous quarter. Net income for 3Q26 was NT$763.06 billion, up 68.7% from a year earlier. 3Q26 EPS was $4.60, which was a beat from the consensus estimate of $4.46. TSMC's gross, operating and net margin for the quarter were 66.4%, 58.7% and 51.1% respectively. TSMC is currently margin diluted, however fewer companies this large are able to convert revenue into profit this efficiently.
AI Is Now Most of the Business
AI dominance, what catches my attention? Very high performance computing, which consists of AI accelerators for customers like Nvidia, made up 68% of revenue, up from 57% a year prior.
The CEO, C.C. Wei, described demand for leading edge chips as “extremely robust” and mentioned agentic AI as a new trend. Management also mentioned the potential for faster annual growth for AI accelerators from the current target of the mid- to high-50s percentage growth.
The 2nm Ramp Is Fast, and It Costs Margin
TSMC’s latest 2nm node contributed 8% of wafer revenue in Q3, up from 3% a quarter prior. Chips at 7nm and below made up 79% of wafer revenue.
Of course, that speed comes at a cost. Newer nodes, like the 2nm node, have lower margins until manufacturing yields and volume improve. That dilution of margins, in my opinion, is the main reason the stock declined despite the strong beats.
Guidance: Faster Growth, Softer Margins
TSMC expects revenue of $52.3 to $54.3 billion in Q4, up about 14% sequentially. The company also increased its full year 2026 growth outlook to approximately 44% from the U.S. dollar currency exchange rates, from slightly above 40% in July.
The caution was more around margins. Management expects Q4 gross and operating margins to be 65% to 67% and 56.5% to 58.5% respectively, down slightly from Q3.
Capex Is Stepping Up Sharply
TSMC confirmed its capital expenditure guidance for 2026 of $60-64 billion and said spending between 2026 and 2028 would be significantly higher than the last three years.
I’d look for revenue growth to outpace capex. If AI demand softens while capex increases, returns on capital will become subpar.
Sentiment, Not Fundamentals, Drove the Drop
Some of the weakness in AI stocks was due to external factors. The debt of CoreWeave, a cloud provider, raised concerns about the debt levels of other AI infrastructure stocks. This, coupled with hotter than expected U.S. inflation, negatively impacted sentiment for chip stocks.
TSMC Technical Analysis: TSM Rebounds From $412 Support After Trendline Breakdown
According to my 4-hour chart, TSM is at $422.42, up 0.78% from its session open, after a sharp pullback from the October high at $487.49. TSM broke below an ascending trendline that supported the upward move from late July. A quick look at the 1-minute chart shows that price briefly pierced $412.10 before the bottom began to take shape. $412.10 aligns with the full retracement at $411.83. Further, the downtrend is supported by the blue and red moving averages, at $437.67 and $445.54 respectively, therefore the short-term bias is on the selling side.
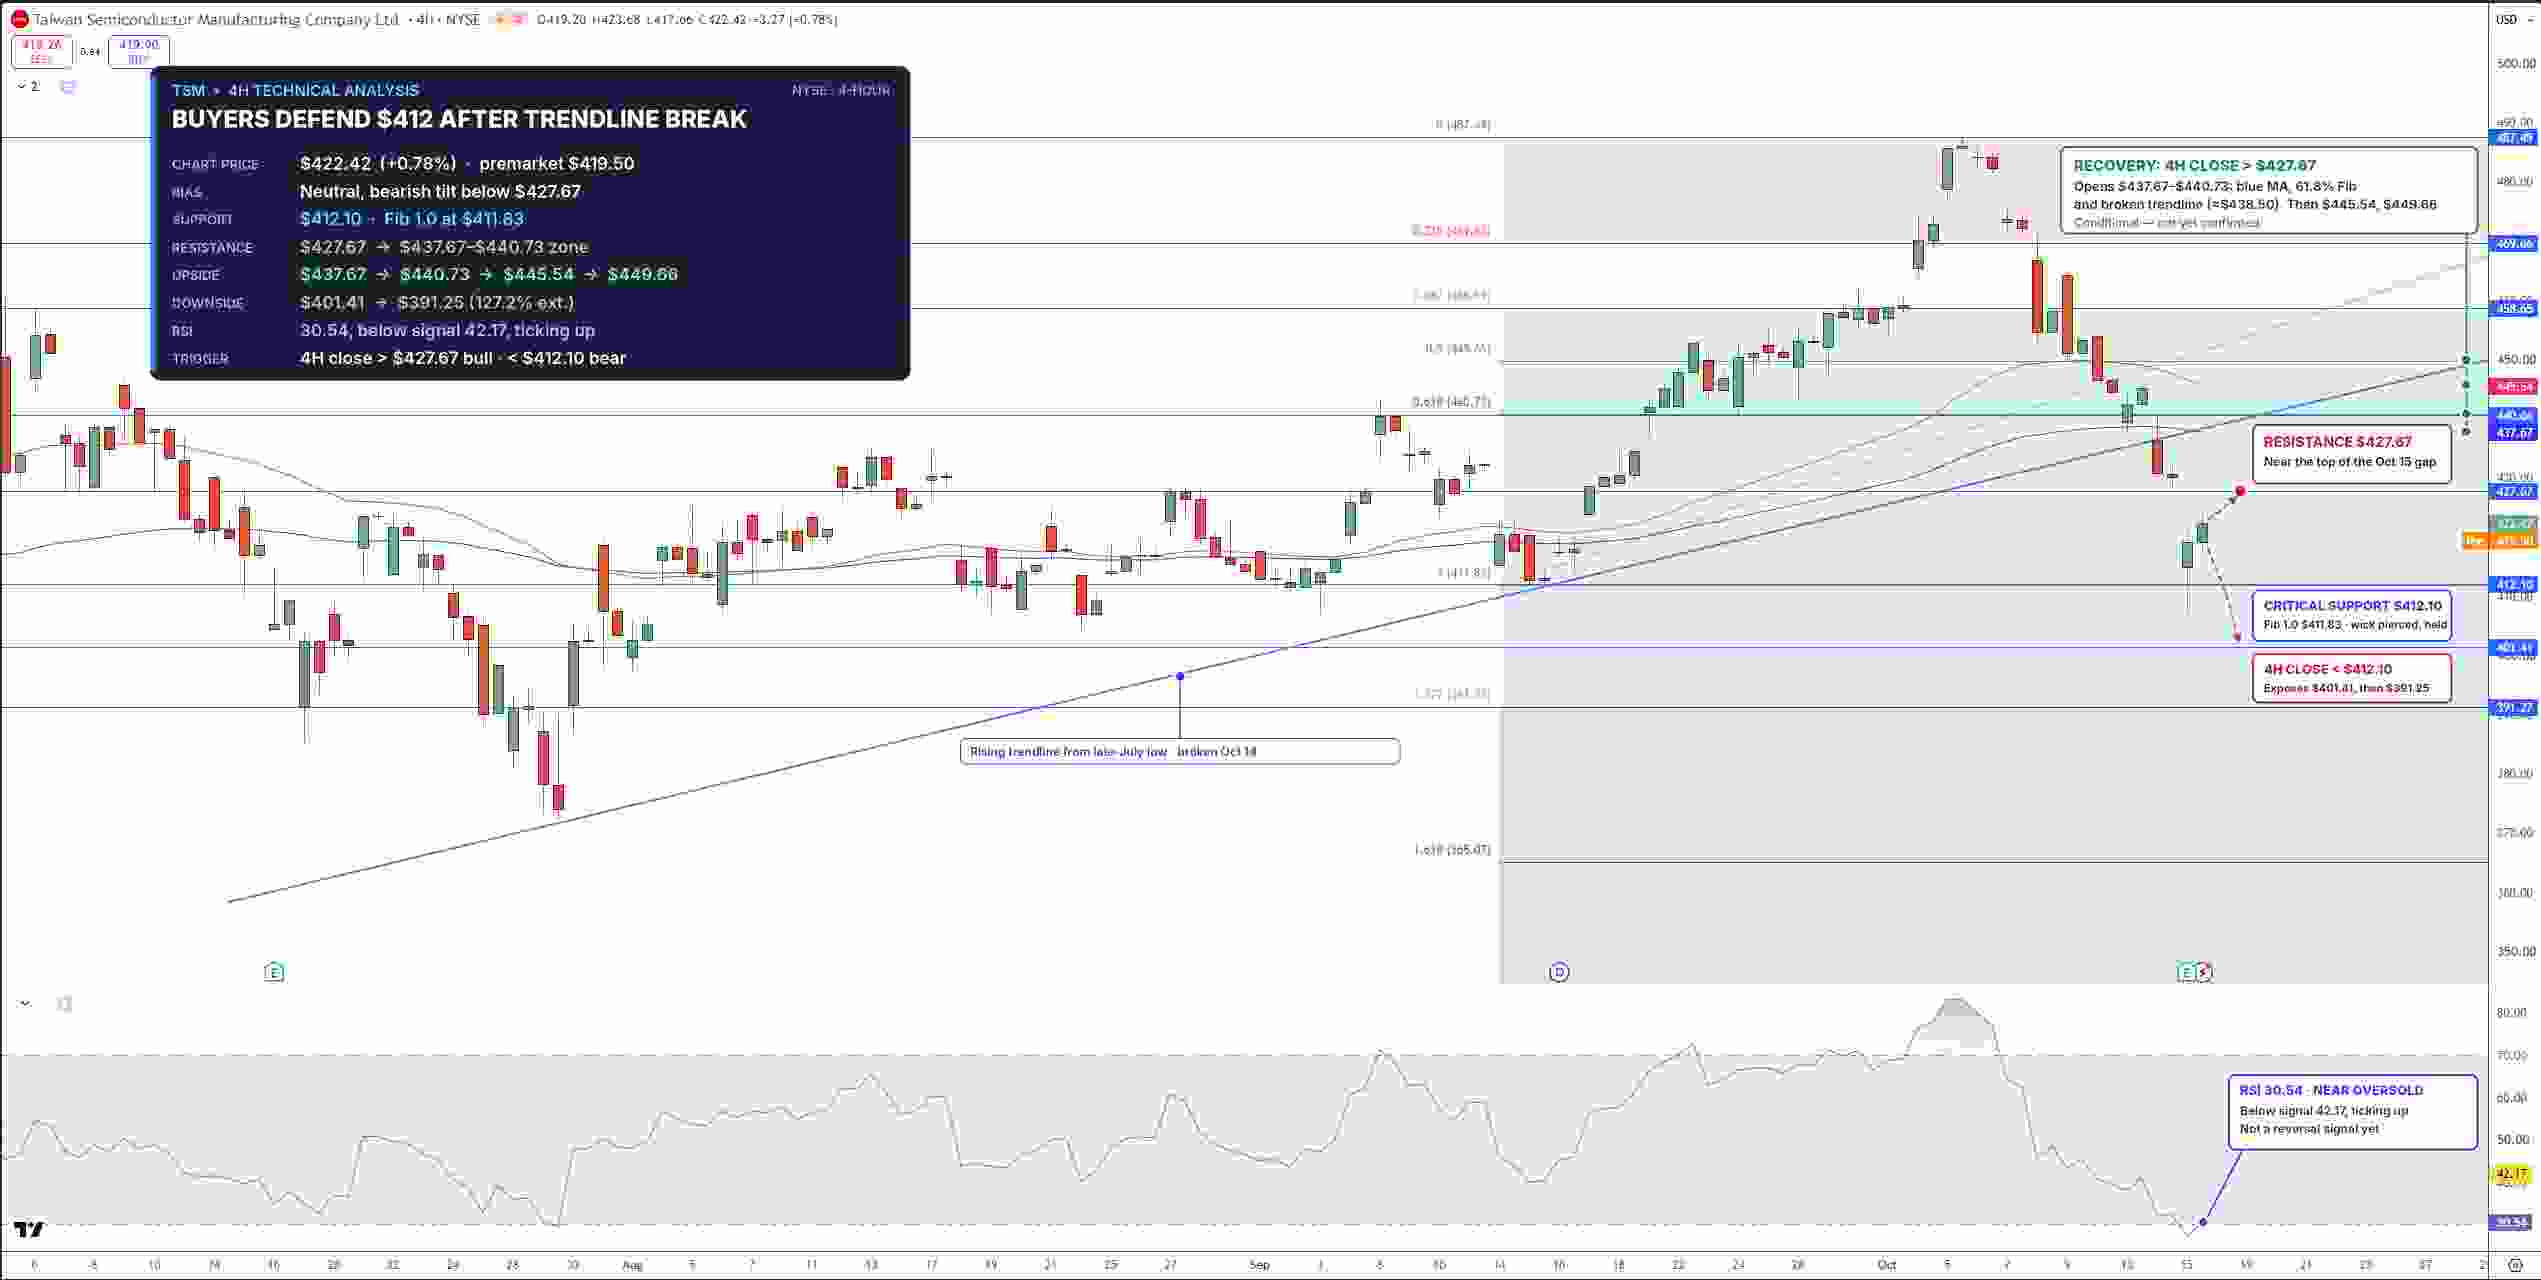
TSMC Stock Price Chart - Source: Tradingview
The Relative Strength Index (RSI) is at 30.54, and sits below its signal line at 42.17, indicating a bearish edge.
Resistance is at the gap down level at $427.67. A 4-hour close above this level will bring the $437.67 area into play. Beyond this area, resistance is at the $440.73 area, which is made up of the 61.8% Fibonacci retracement level and the blue moving average. Finally, the resistance area is capped at $445.54 and $449.66. A 4-hour close below $412.10 will expose $401.41 and the 127.2% extension down at $391.25. I am bearish below $427.67.
Key Levels
- Last Close: $422.25, down about 2% on October 15
- Support: $412.10, $401.41, $391.25
- Resistance: $427.67, $437.67 to $440.73, $445.54, $449.66
- RSI: 30.54, below its signal line at 42.17
- Bullish Trigger: 4-hour close above $427.67
- Bearish Trigger: 4-hour close below $412.10
FAQs
Why did TSMC stock fall after beating Q3 estimates?
TSMC beat its Q3 estimates and projected 44% growth for 2026, but the stock fell because of expectations for narrower margins and higher spending, as well as the broader AI sell-off.
What is the TSMC stock forecast for next week?
The bias is neutral to bearish, with a bearish bias under $427.67. A close above $427.67 targets $437.67 and $440.73, while a close below $412.10 targets $401.41.
Bottom Line
TSMC’s fundamentals have rarely been as strong as now, but the market is pricing higher spending and larger margin dilution. The opportunity is a move toward $440.73 if $412.10 holds and sales confirm momentum in November. Risks are larger AI selling, higher spending, and further dilution of margins and cash flow. A close above $445.54 cancels the bearish bias. A close below $412.10 confirms bearish bias.
Recommended Articles


