


This Unstoppable Vanguard ETF Could Turn $500 Per Month Into $1 Million Over the Long Term
Key Points
The S&P 500 Growth index exclusively holds 151 of the best-performing growth stocks from the regular S&P 500.
The Growth index has returned over 28% annually during the last three years, thanks to its high degree of exposure to AI stocks.
The Vanguard S&P 500 Growth ETF mimics the Growth index, and it could turn a consistent monthly investment into life-changing wealth.
- Motley Fool Issues Rare "Total Conviction" Buy Alert ›
The S&P 500 is a diversified index of 500 American companies from 11 different sectors of the economy. But then there is the S&P 500 Growth index, which holds only 151 of the best-performing growth stocks from the regular S&P 500.
Growth stocks are known for delivering high capital gains, separating them from value stocks which offer more modest returns supplemented by dividend income. As a result, the Growth index typically outperforms the S&P 500 over the long run, although it does experience more volatility during periods of uncertainty.
Missed AI’s "Act 1"? Act 2 Could Be 15x Bigger. Most investors think they missed the AI boat because they didn't buy Nvidia in 2005. But according to our analysts, we’re only at the end of "Act 1"—the R&D phase. "Act 2" is the global rollout. Continue »
The Vanguard S&P 500 Growth ETF (NYSEMKT: VOOG) is an exchange-traded fund (ETF) that mimics the Growth index, and here's how it could turn a monthly investment of $500 into $1 million over the long term.

Image source: Getty Images.
A portfolio of America's best growth stocks
The S&P 500 Growth index chooses stocks based on factors like their momentum, and the sales growth of the underlying companies. Technology stocks, particularly those at the center of the artificial intelligence (AI) boom, are consistently leading the rest of the market in both sales growth and momentum at the moment, which is why the Vanguard S&P 500 Growth ETF has 53% of its assets parked in the information technology sector alone.
In fact, four of the top five holdings in the ETF are from the information technology sector, and they account for 36.5% of the value of its entire portfolio.
|
Stock |
Sector |
Vanguard ETF Weighting |
|---|---|---|
|
1. Nvidia |
Information Technology |
14.83% |
|
2. Microsoft |
Information Technology |
10.45% |
|
3. Apple |
Information Technology |
6.45% |
|
4. Alphabet |
Communication Services |
5.52% |
|
5. Broadcom |
Information Technology |
4.86% |
Data source: Vanguard. Portfolio weightings are accurate as of Aug. 31, 2026, and are subject to change.
Nvidia, Microsoft, Apple, Alphabet, and Broadcom have delivered a median return of 300% since the start of 2023, which coincides with the beginning of the AI revolution. That's nearly triple the return the S&P 500 produced over the same period.
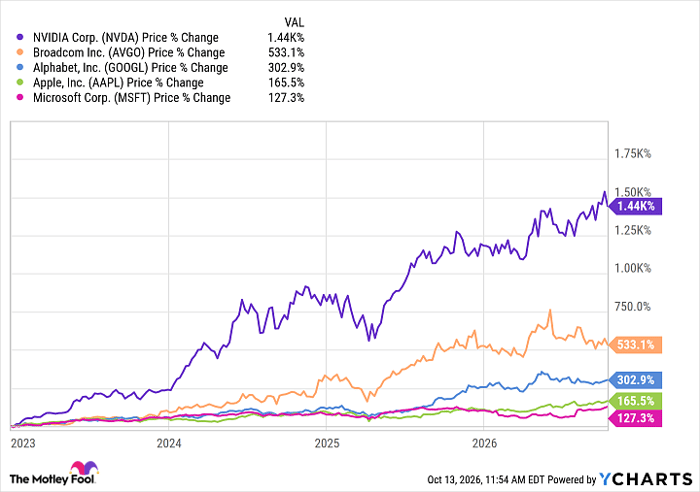
NVDA data by YCharts
Nvidia and Broadcom supply some of the world's best data center chips and components for AI development. But the Vanguard ETF also holds Advanced Micro Devices and Micron Technology, two other leading chip suppliers, which have soared in value by 800% and 1,780% respectively since the start of 2023.
The ETF holds many other AI stocks that fall into sectors other than information technology, including Amazon, Meta Platforms, and Tesla. But it also offers a splash of diversification through non-AI holdings like Berkshire Hathaway, investment bank JPMorgan Chase, and consumer products conglomerate Johnson & Johnson.
Turning $500 per month into $1 million
The Vanguard S&P 500 Growth ETF has delivered a compound annual return of 16.9% since it was established in 2010, comfortably beating the S&P 500 which climbed by an average of 14.1% per year over the same period. The ETF has also produced a much faster annual return of 28.4% over the last three years, specifically, driven by AI stocks.
Here's how long it could take to turn a consistent investment of $500 per month into $1 million, based on three different average annual returns.
|
Monthly Investment |
Compound Annual Return |
Time To Reach $1 Million |
Total Investment |
|---|---|---|---|
|
$500 |
14.1% |
22 Years and 9 Months |
$137,000 |
|
$500 |
16.9% |
20 Years and 1 Month |
$121,000 |
|
$500 |
28.4% |
13 Years and 9 Months |
$83,000 |
Calculations by author.
It's unrealistic to expect any ETF to consistently return over 20% per year over the long run, because the law of large numbers eventually gets in the way. For example, if Nvidia's market cap grew by 20% per year even for the next 10 years, it would become a $34 trillion company, making it more valuable than the annual output of the entire U.S. economy.
But even if the Vanguard ETF produces a below-average return of 14.1% per year (aligning with the S&P 500 since 2010) going forward, it can still turn a monthly investment of $500 into $1 million in just under 23 years.
The S&P 500 Growth index (and the Vanguard ETF by extension) rebalances once per quarter by removing stocks that no longer meet its criteria and replacing them with better candidates. Therefore, even if the AI boom runs out of steam, companies leading future growth industries like robotics, autonomous driving, or even quantum computing could take over to drive returns.
That's why I believe this ETF will continue to beat the S&P 500 over the long term, making it a strong candidate to potentially turn consistent monthly investments into life-changing wealth.
Should you buy stock in Vanguard Admiral Funds - Vanguard S&P 500 Growth ETF right now?
Before you buy stock in Vanguard Admiral Funds - Vanguard S&P 500 Growth ETF, consider this:
The Motley Fool Stock Advisor analyst team just identified what they believe are the 10 best stocks for investors to buy now… and Vanguard Admiral Funds - Vanguard S&P 500 Growth ETF wasn’t one of them. The 10 stocks that made the cut could produce monster returns in the coming years.
Consider when Netflix made this list on December 17, 2004... if you invested $1,000 at the time of our recommendation, you’d have $391,581!* Or when Nvidia made this list on April 15, 2005... if you invested $1,000 at the time of our recommendation, you’d have $1,334,780!*
Now, it’s worth noting Stock Advisor’s total average return is 936% — a market-crushing outperformance compared to 213% for the S&P 500. Don't miss the latest top 10 list, available with Stock Advisor, and join an investing community built by individual investors for individual investors.
See the 10 stocks »
*Stock Advisor returns as of October 16, 2026.
JPMorgan Chase is an advertising partner of Motley Fool Money. Anthony Di Pizio has no position in any of the stocks mentioned. The Motley Fool has positions in and recommends Advanced Micro Devices, Alphabet, Amazon, Apple, Berkshire Hathaway, Broadcom, JPMorgan Chase, Meta Platforms, Micron Technology, Microsoft, Nvidia, and Tesla. The Motley Fool recommends Johnson & Johnson. The Motley Fool has a disclosure policy.
Recommended Articles


