


Dell Stock Forecast: Barclays Downgrade Drags DELL to $452 Support Despite $95 Billion AI Backlog
TradingKey - Dell Technologies (NYSE: DELL) dropped 6.80% on Thursday, October 15 to close at $473.39. This was after a 11% drop the day before, for a two-day decline of about 17% after Barclays analyst Tim Long reduced his rating from Overweight to Equal-Weight and cut his target price from $603 to $574.
I think this is more of a valuation reset than an earnings issue. Long-term, Dell’s AI backlog remains strong, but shares are now pricing in a negative view until they prove they can grow that backlog and convert it to revenues quickly.
Why Barclays Downgraded Dell
Long agrees the valuation is extended and feels broader enterprise tech spending has not materially benefitted from AI.
Even after Long’s downgrade, the $574 target remains roughly 21% above Thursday’s close. What’s interesting is how negatively the market viewed a Neutral rating, which probably means there was a lot of bullishness and positioning.
Record Q2 Shows the Fundamentals Have Not Broken
Fiscal Q2 2027, which ended July 31, was Dell’s best quarter ever. Total revenues rose 58% to $47.0 billion, with the ISG (Infrastructure Solutions Group) reporting revenues of $31.8 billion, up 89% from the prior year.
AIM2 AI-optimized servers reported revenues of $16.4 billion, up 100% from the prior year. Operating income grew 204% from the prior year to $5.39 billion. GAAP diluted EPS was $6.34, up from $1.70 in the prior year, and non-GAAP EPS grew 203% from the prior year to $7.04. ISG’s operating margin improved to 15% from 8.8% in the prior year.
A $95 Billion Backlog Gives Rare Visibility
Dell announced record quarterly artificial intelligence (AI) server orders of $60.9 billion, lifting its AI server backlog to $95 billion. AI server orders increased about 150% quarter-over-quarter.
Management raised its fiscal 2027 guidance by $25 billion and expects total revenue of $192 billion, AI server revenue of $74 billion and non-GAAP EPS of $25.50. For fiscal Q3, Dell expects revenue of $49 billion, up 81%, and non-GAAP EPS of $6.50.
Second-Half Execution Is the Real Test
Achieving the second half revenue goal is a challenge. AI server revenue for the first half of the year was $32.5 billion, so revenue in the second half of the year would need to be $41.5 billion to achieve the target. This would require average quarterly revenue of $21 billion, compared to $16.4 billion in Q2.
The backlog provides visibility into meeting this target more than twice over. The main constraint is supply, in particular, memory. I would focus more on Dell's ability to ship products at a faster pace compared to its peers and before giving back margin.
PCs Are the Weak Flank
Revenue from Dell's Client Solutions group, which includes PCs and other client computing devices, increased 20% to $15.0 billion in Q2, driven by a 22% increase in commercial revenue and a 7% increase in consumer revenue.
I expect PCs to be the soft spot in the next report based on IDC's estimate that global PC shipments fell 20.1% in calendar Q3. IDC also estimates Dell's shipments fell 25%, worse than the market, to 7.6 million units.
Shareholder Returns, Insider Sales and the Japan Pipeline
Dell paid shareholders $4.3 billion in Q2. The next quarterly dividend of $0.63, payable to holders of record as of October 20, will be paid October 30.
Dell signed a non-binding memorandum of understanding with JERA and RHAELM on October 1 to build a 400-megawatt AI data center in Chiba, Japan, expected to begin operations in 2028. The project is valued at $15 billion. I am viewing that as pipeline.
Dell Technical Analysis: DELL Defends $452 Support After Sharp Trendline Breakdown
Dell closed at $473.39, down 6.80% and testing $452.42. After gapping lower, price broke the daily trendline and the red moving average (currently at $512.94), found support at the blue moving average at $452.69 and turned higher to close at $473.39. Long lower shadow shows buyers remained active, however the trendline break damaged the overall bullish trend. We remain bullish for the medium term.
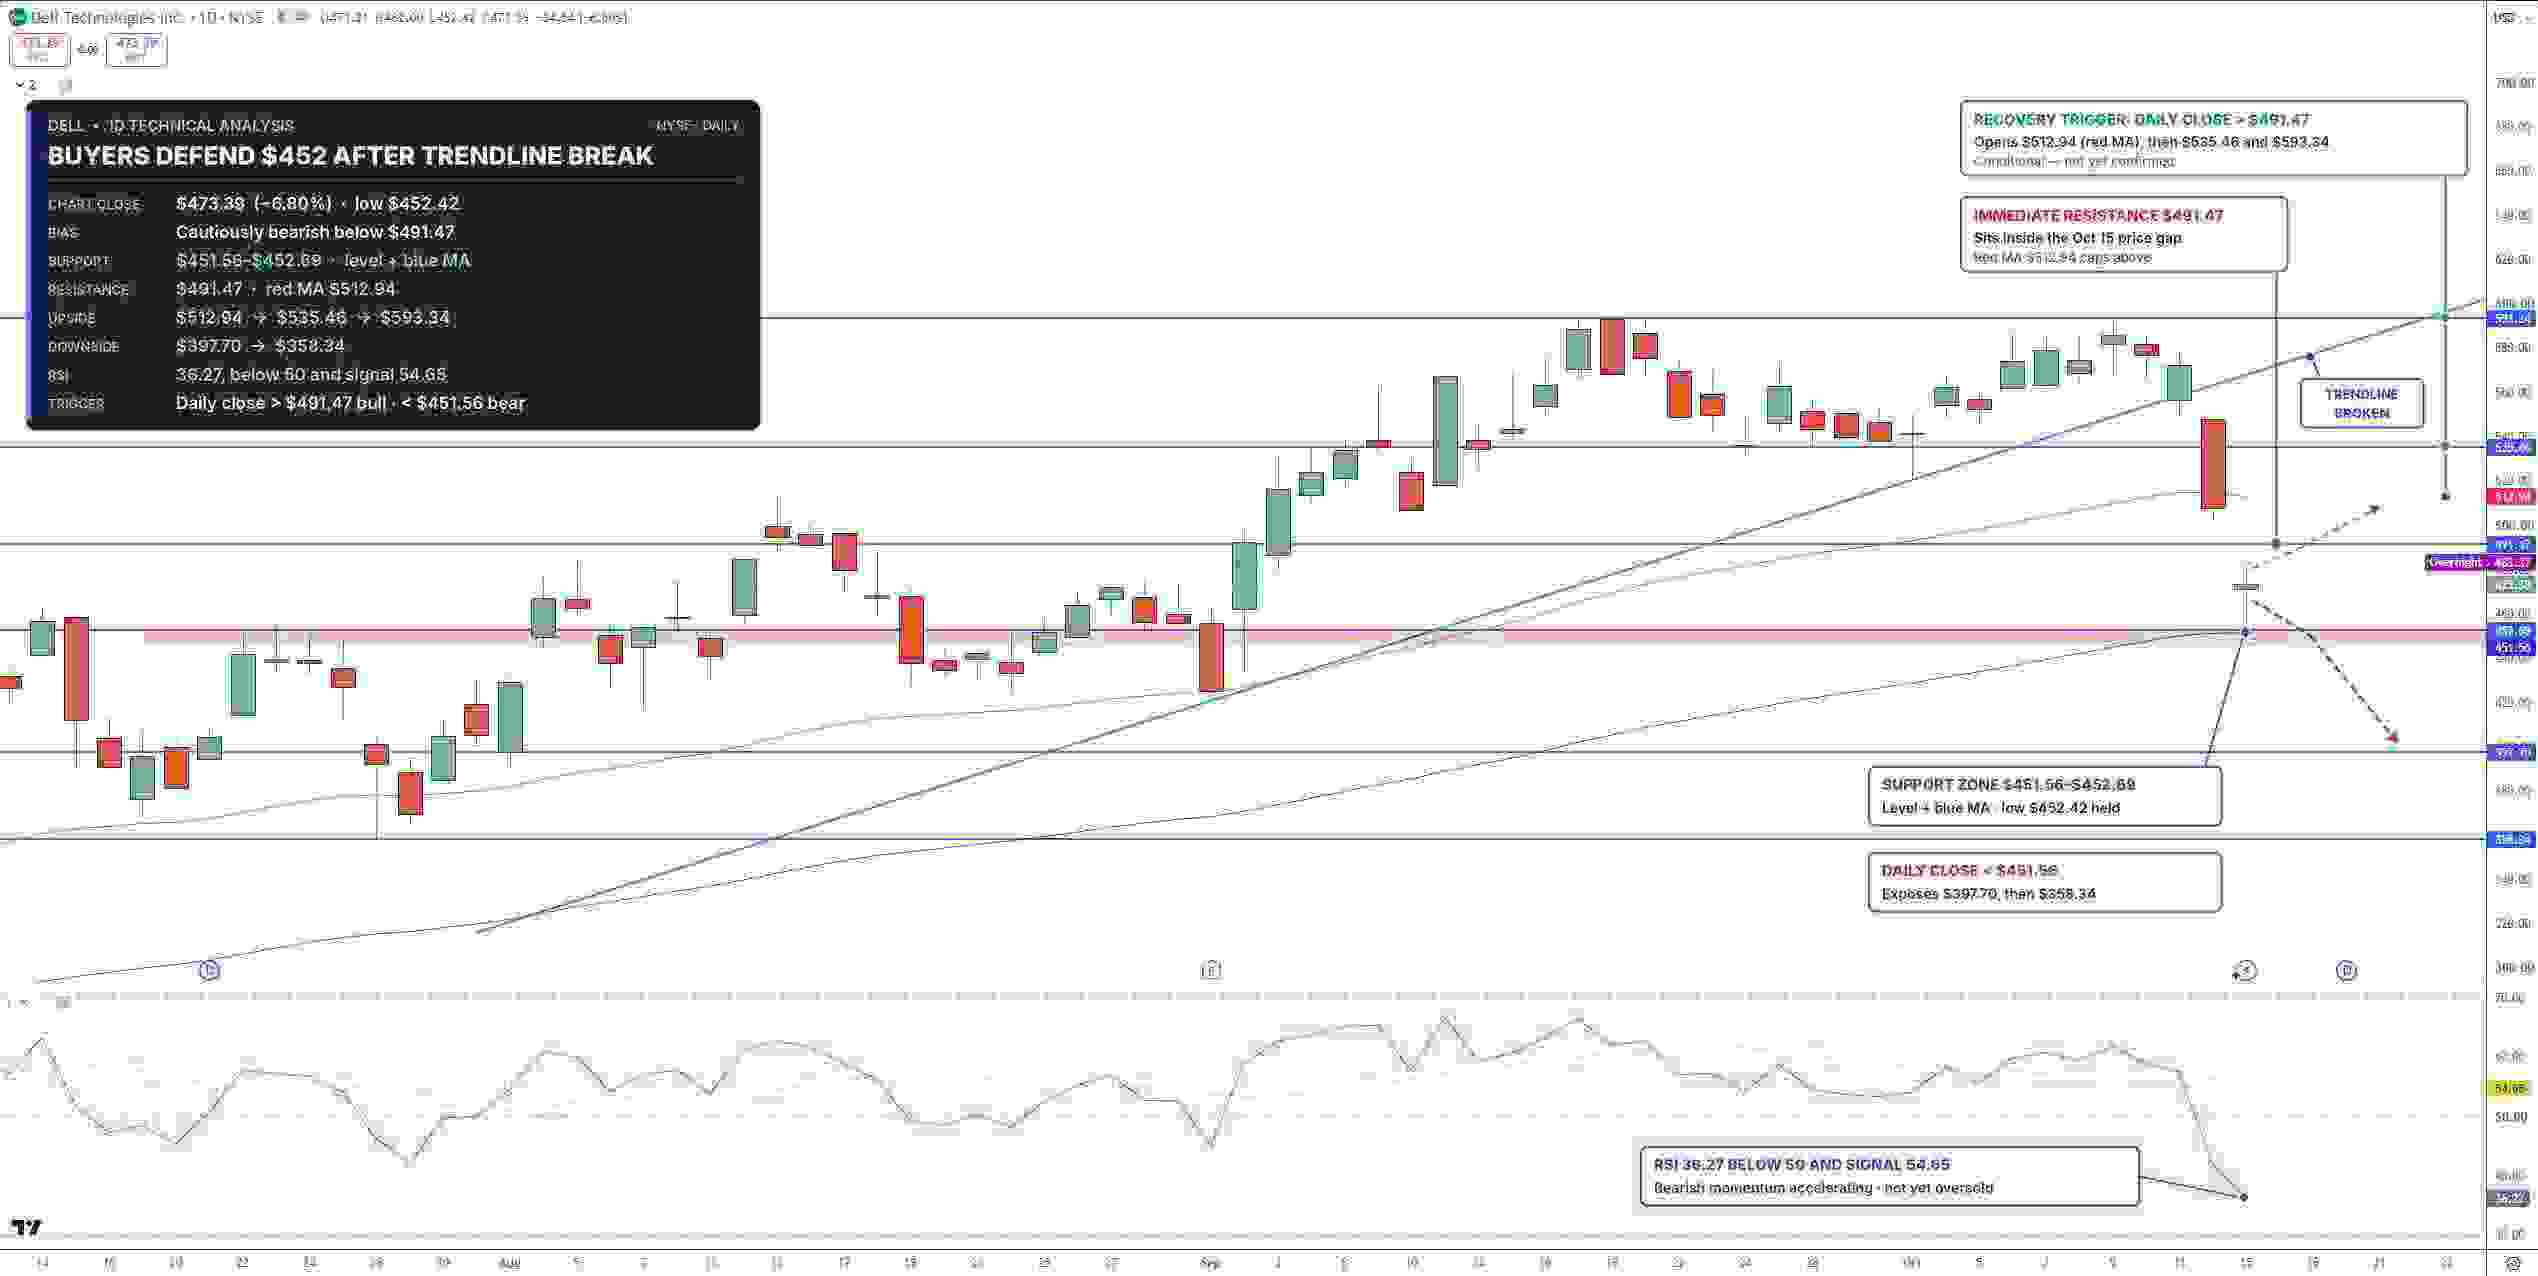
Dell Stock Price Chart - Source: Tradingview
The RSI has pulled down to 36.27. This is well below the 50 midline and signal line 54.65. The moving average has also crossed down. Momentum is bearish, but not oversold to the downside. A bounce back to the moving average could occur.
Closest resistance is located at $491.47, which is the bottom of this week's gap. Further resistance comes in at $512.94, $535.46 and $593.34.
The October low comes in at $451.56. A move below this would also break the blue moving average as well as the horizontal support. Further support comes in at $397.70 and $358.34. I'm slightly bearish DELL as long as it trades under $491.47.
Key Levels
Latest Close: $473.39, down 6.80% on October 15
Support: $451.56 to $452.69, $397.70, $358.34
Resistance: $491.47, $512.94, $535.46, $593.34
RSI: 36.27, below its 54.65 signal line
Bullish trigger: Close above $491.47
Bearish trigger: Close below $451.56
FAQs
Why did Dell stock fall after the Barclays downgrade?
Barclays downgraded Dell to Equal-Weight from Overweight and lowered its price target to $574, citing valuation. Dell’s earnings and guidance were unchanged, and thus, the stock price decline does not reflect deterioration in the company’s financial condition.
What is the Dell stock forecast for the coming weeks?
The near-term bias is bearish below $491.47. A breakdown below $451.56 would open the bearish target of $397.70. A move back above $491.47 would reopen the bullish target of $512.94 and $535.46.
Bottom Line
Dell’s fundamentals are better than its technicals. I like Dell at these levels for a move back to $512.94. I’d view a move below the $452 zone as bearish. Risks to this view are memory costs, a deepening PC cycle, and further valuation cuts. The $491.47 level is a key short-term resistance level while a close below $451.56 is bearish.
Recommended Articles


