

SCHD vs. VYM: Which High-Yield ETF Should You Own?

Source The Motley Fool

Key Points

  • The Schwab U.S. Dividend Equity ETF (SCHD) looks for elements of balance sheet strength, yield, and dividend growth in its stock selection process.

  • The Vanguard High Dividend Yield ETF (VYM), on the other hand, is more of a pure high-yield play.

  • SCHD's portfolio composition gives it the advantage in the current environment.

  • 10 stocks we like better than Vanguard High Dividend Yield ETF ›

With long-term bond yields now well above 5%, fixed income is posing a real alternative to traditional dividend stock exchange-traded funds (ETFs). Treasury yields are now more than twice those of many dividend ETFs, which means the target is changing for what type of fund you want to own and why.

The two most prominent high-yield equity ETFs are the Schwab U.S. Dividend Equity ETF (NYSEMKT: SCHD) and the Vanguard High Dividend Yield ETF (NYSEMKT: VYM). Between the two, I'd clearly favor the Schwab U.S. Dividend Equity ETF.

Missed Nvidia in 2009? This Rare Signal Is Flashing Again. In 2009, a "Double Down" signal flashed for a little-known chipmaker called Nvidia. For the first time in years, that same "Total Conviction" signal is flashing for a company 1/100th the size of Nvidia. Continue »
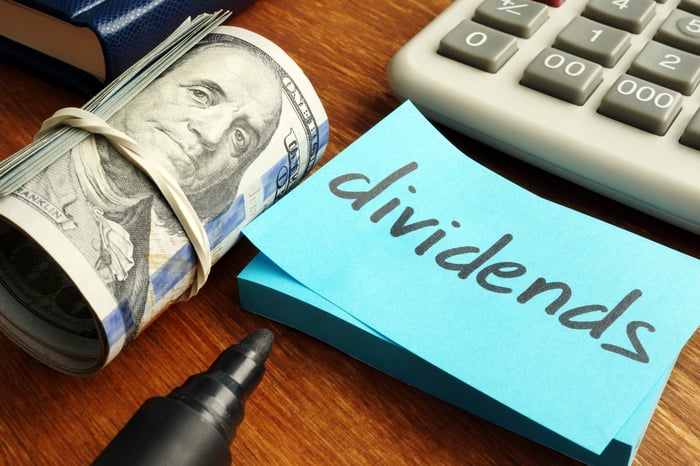
Rolled-up hundred-dollar bills and a post-it saying "dividends."

Image source: Getty Images.

It's outperforming the Vanguard High Dividend Yield ETF by more than 12% year-to-date, but that's not the primary reason I'm choosing it.

The Schwab ETF's stock selection strategy considers several fundamental balance-sheet strength metrics, the stock's historical dividend growth rate, and its yield. That mix of factors helps the fund offer a solid 3.3% dividend yield.

The Vanguard ETF, on the other hand, selects stocks purely based on yield. It starts with a broad U.S. equity universe and invests in the top half of yields within that group. There's no consideration for the quality of dividend growth in its process. Its 2.4% yield is also substantially lower.

But portfolio composition is the deciding factor. With rates already high and potentially going higher, rate-sensitive sectors become especially vulnerable. The Vanguard High Dividend Yield ETF has greater allocations to financials, utilities, and tech, all of which are sensitive to interest rate movements.

The Schwab U.S. Dividend Equity ETF, however, is mostly overweight to consumer staples and healthcare, two sectors likely to be more defensive and durable in the event of an economic downturn.

With a higher yield, a strong track record, and a portfolio built better for current macro conditions, the Schwab U.S. Dividend Equity ETF would be my preferred dividend ETF to own.

Should you buy stock in Vanguard High Dividend Yield ETF right now?

Before you buy stock in Vanguard High Dividend Yield ETF, consider this:

The Motley Fool Stock Advisor analyst team just identified what they believe are the 10 best stocks for investors to buy now… and Vanguard High Dividend Yield ETF wasn’t one of them. The 10 stocks that made the cut could produce monster returns in the coming years.

Consider when Netflix made this list on December 17, 2004... if you invested $1,000 at the time of our recommendation, you’d have $379,986!* Or when Nvidia made this list on April 15, 2005... if you invested $1,000 at the time of our recommendation, you’d have $1,404,152!*

Now, it’s worth noting Stock Advisor’s total average return is 948% — a market-crushing outperformance compared to 215% for the S&P 500. Don't miss the latest top 10 list, available with Stock Advisor, and join an investing community built by individual investors for individual investors.

See the 10 stocks »

*Stock Advisor returns as of October 15, 2026.

David Dierking has positions in Schwab U.S. Dividend Equity ETF. The Motley Fool has positions in and recommends Vanguard High Dividend Yield ETF. The Motley Fool has a disclosure policy.

Disclaimer: For information purposes only. Past performance is not indicative of future results.
placeholder
October hike odds climb toward 60% as Goldman and BofA both flip — what Warsh's "dose of accommodation" really changedRate futures now price roughly 55% to 62% for a 25bp hike at the October 27-28 FOMC, up from about 30% before Chair Warsh's post-meeting framing that the Fed is merely "removing some accommodation." Goldman Sachs has added an October hike to its forecast and Bank of America now sees moves in both October and December. Here is the repricing, the language behind it, and the two data points that decide it.
Author  Irene Q.
Sep 23, Wed
Rate futures now price roughly 55% to 62% for a 25bp hike at the October 27-28 FOMC, up from about 30% before Chair Warsh's post-meeting framing that the Fed is merely "removing some accommodation." Goldman Sachs has added an October hike to its forecast and Bank of America now sees moves in both October and December. Here is the repricing, the language behind it, and the two data points that decide it.
placeholder
Strong profits, falling shares: bank earnings day one meets a memory-chip rout — with CPI and ASML aheadGoldman Sachs blew past estimates (EPS $17.01 vs $13.09 expected, profit +33%) while JPMorgan missed ($5.75 vs $5.93) and Wells Fargo fell 3% — yet the S&P 500 finished flat at 7,805.45, pinned below its record close as a memory-chip rout (SOX −2.67%, Micron under $1,000) kept the pressure on. Tonight brings the week's decider: US September CPI at 8:30 ET, then Bank of America, Morgan Stanley, BlackRock and ASML before the open. Here are the levels, both cases, and the watch list.
Author  Irene Q.
Oct 14, Wed
Goldman Sachs blew past estimates (EPS $17.01 vs $13.09 expected, profit +33%) while JPMorgan missed ($5.75 vs $5.93) and Wells Fargo fell 3% — yet the S&P 500 finished flat at 7,805.45, pinned below its record close as a memory-chip rout (SOX −2.67%, Micron under $1,000) kept the pressure on. Tonight brings the week's decider: US September CPI at 8:30 ET, then Bank of America, Morgan Stanley, BlackRock and ASML before the open. Here are the levels, both cases, and the watch list.
placeholder
US September CPI recap: inflation hits 3.7% as core runs hot — is an October Fed hike back on the table?September CPI landed hot: headline 3.7% y/y, core 2.6% y/y and 0.3% m/m. October hike odds jumped from ~22% to ~37% — yet the dollar faded to 101.74, gold closed higher and the S&P 500 fell 1.11%. Here is the full repricing, the levels and what to watch next.
Author  Irene Q.
19 hours ago
September CPI landed hot: headline 3.7% y/y, core 2.6% y/y and 0.3% m/m. October hike odds jumped from ~22% to ~37% — yet the dollar faded to 101.74, gold closed higher and the S&P 500 fell 1.11%. Here is the full repricing, the levels and what to watch next.
placeholder
Gold defends $4,100 as BofA targets a break below $4,000 — why the Middle East bid is missingSpot gold flushed to $4,099.89, a whisker above October's $4,090 low, then rebounded to close at $4,138.25 (+0.82%) — even as US CPI ran hot. Bank of America sees gold below $4,000 within three months, citing shrinking demand and official-sector selling. Here are the levels, the drivers and what would flip the script.
Author  Irene Q.
18 hours ago
Spot gold flushed to $4,099.89, a whisker above October's $4,090 low, then rebounded to close at $4,138.25 (+0.82%) — even as US CPI ran hot. Bank of America sees gold below $4,000 within three months, citing shrinking demand and official-sector selling. Here are the levels, the drivers and what would flip the script.
placeholder
Gold Price Analysis Today | Forex Gold Analysis | XAU/USD Analysis - October 15, 2026Get the latest gold price analysis, forex gold insights, and XAU/USD analysis for October 15, 2026. Read on for the details.
Author  Mitrade
18 hours ago
Get the latest gold price analysis, forex gold insights, and XAU/USD analysis for October 15, 2026. Read on for the details.
goTop
quote