


The Stock Market Is Echoing a Warning From the Dot-Com Bubble, and History Says Investors Should Make This 1 Move
Key Points
The S&P 500 has reached record highs and is heading for a gain of about 100% over four years.
A trouble spot has appeared, however, and could potentially weigh on stock performance.
- 10 stocks we like better than S&P 500 Index ›
The S&P 500 has been climbing in recent years, reaching multiple record highs, and the momentum has generally continued in 2026. If we look at the past three calendar years and add in the performance this year so far, the gain totals 100%. And one thing in particular has fueled this movement: investors' excitement about artificial intelligence (AI).
AI, with its potential to transform the way many things are done and supercharge corporate earnings growth, looks like the next big thing in technology -- and a bet in such a space could result in a major win for investors. Many investors have already experienced this victory, considering the double-, triple-, and even quadruple-digit gains of some AI stocks over the past few years. For example, AI chip leader Nvidia has jumped 900% in five years, and memory and storage maker Micron Technology has climbed 200% this year alone.
Missed Nvidia in 2009? This Rare Signal Is Flashing Again. In 2009, a "Double Down" signal flashed for a little-known chipmaker called Nvidia. For the first time in years, that same "Total Conviction" signal is flashing for a company 1/100th the size of Nvidia. Continue »
Since many companies operating in AI are also tech giants that are heavily weighted in the S&P 500, their gains have offered the index a clear direction. Of course, stocks across industries have also advanced, but tech players have played the biggest role.
Against this positive backdrop, however, a storm may be brewing. The stock market is echoing a warning from the dot-com bubble, and history says investors should make one move in particular.

Image source: Getty Images.
Today's market situation
So, first let's dive a little deeper into the current market situation. Investors have been piling into AI stocks in recent years as companies develop the technology, and AI is increasingly being put to use -- though we're in the early days of this phase. As all of that unfolded, certain companies, such as chip designers and cloud companies, began generating significant revenue. Today, with demand for chips and infrastructure high, tech giants must invest heavily to keep pace. For example, Amazon, Microsoft, Alphabet, and Meta Platforms are expected to spend more than $700 billion this year.
Meanwhile, some investors have wondered whether the revenue opportunity will truly justify such spending levels -- and this concern has weighed periodically on the performance of AI stocks. Other headwinds include questions about rising inflation and interest rate levels in the months to come as well as general concerns about the economy and geopolitical environment. All of this has put pressure on stocks on occasion this year, but, overall, the S&P 500 and investors have managed to shake off the worries.
Now, let's consider the storm that's brewing behind the scenes. The stock market is echoing a warning that we saw at a troubling time, during the dot-com bubble... and this is a significant increase in one particular metric. I'm talking about the Buffett indicator, which measures the value of all U.S. publicly listed companies in relation to the country's gross domestic product.
Buffett favors this valuation measure
Billionaire investor Warren Buffett introduced this measure in an essay in Fortune back in 2001. "It is probably the best single measure of where valuations stand at any given moment," he wrote.
Today, this indicator delivers an alarming message: It has reached the level of 238%, its highest ever. For reference, it came in at about 148% during the dot-com bubble. So this tells us that stocks are historically expensive today and the underlying economy isn't driving the gains.
What may happen next? A look at history, focusing on the dot-com era back in 2000 and late 2021 when the Buffett indicator soared once again, may offer some answers.
The S&P 500 fell following these peak Buffett indicator readings, and that suggests the stock market today may also be heading for a decline. But before you get too worried about this potential happening, it's important to look a bit farther down the road. And here, we can see that each time, the S&P 500 has always recovered and then gained over a number of years.
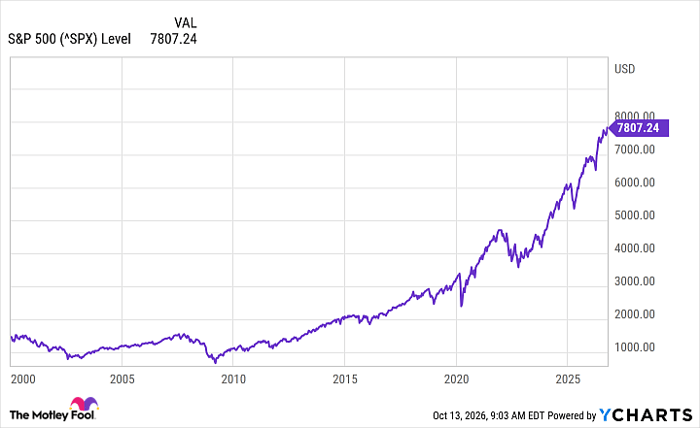
^SPX data by YCharts
History tells us you should make one key move now, and that's to hold onto your positions for the long term. Even if stocks follow historical patterns and decline, the market has proven its ability to deliver a win to investors over the long run. By jumping out of the market, you could incur losses and miss out on gains farther up the path. So, even if the Buffett indicator is flashing a warning signal, the best thing you can do is stay calm and wait for any potential storm to pass.
Should you buy stock in S&P 500 Index right now?
Before you buy stock in S&P 500 Index, consider this:
The Motley Fool Stock Advisor analyst team just identified what they believe are the 10 best stocks for investors to buy now… and S&P 500 Index wasn’t one of them. The 10 stocks that made the cut could produce monster returns in the coming years.
Consider when Netflix made this list on December 17, 2004... if you invested $1,000 at the time of our recommendation, you’d have $379,986!* Or when Nvidia made this list on April 15, 2005... if you invested $1,000 at the time of our recommendation, you’d have $1,404,152!*
Now, it’s worth noting Stock Advisor’s total average return is 948% — a market-crushing outperformance compared to 215% for the S&P 500. Don't miss the latest top 10 list, available with Stock Advisor, and join an investing community built by individual investors for individual investors.
See the 10 stocks »
*Stock Advisor returns as of October 15, 2026.
Adria Cimino has positions in Amazon. The Motley Fool has positions in and recommends Alphabet, Amazon, Meta Platforms, Micron Technology, Microsoft, and Nvidia. The Motley Fool has a disclosure policy.
Recommended Articles


