


Democrats Have a 93% Chance of Retaking at Least One House of Congress on Nov. 3 -- History Says That's Bad News for Stocks
Key Points
Midterm elections are 25 days away, with prediction markets increasingly calling for a Democrat sweep of Congress.
Based on 98 years of S&P 500 returns, only one of four congressional scenarios is unfavorable for the stock market -- and it appears to be setting up right now.
Equities thrive over the long run, no matter who’s running the show on Capitol Hill.
- 10 stocks we like better than S&P 500 Index ›
The next four weeks are potential game-changers for the U.S. economy and stock market. The Social Security cost-of-living adjustment (COLA) reveal is five days away (Oct. 14), the Federal Reserve's October meeting is less than three weeks away (Oct. 28), and midterm elections are knocking on the door (Nov. 3).
The latter event, midterm elections, could be especially impactful on the U.S. economy and Wall Street's major stock indexes, the Dow Jones Industrial Average (DJINDICES:^DJI), S&P 500 (SNPINDEX:^GSPC), and Nasdaq Composite (NASDAQINDEX:^IXIC). While not all decisions on Capitol Hill directly affect the stock market, our elected officials do oversee fiscal policy, which can impact corporate America.
Missed Nvidia in 2009? This Rare Signal Is Flashing Again. In 2009, a "Double Down" signal flashed for a little-known chipmaker called Nvidia. For the first time in years, that same "Total Conviction" signal is flashing for a company 1/100th the size of Nvidia. Continue »

Image source: Official White House Photo by Molly Riley.
Democrats are widely expected to retake the House on Nov. 3
With just 25 days until the midterm elections, prediction markets are narrowing the potential outcomes.
Traders on prediction market Polymarket place a 65% probability of Democrats sweeping on Nov. 3 (i.e., retaking both houses of Congress). Meanwhile, the odds for a Republican sweep are down to just 7%. In other words, there's a 93% probability of Democrats retaking at least one house of Congress, with the House of Representatives being most likely.
For long-term investors, the makeup of Congress doesn't matter much since innovation and corporate earnings growth drive the Dow Jones Industrial Average, S&P 500, and Nasdaq Composite higher over the long term. But it can be a different story over shorter periods.
7% chance Republicans sweep the midterms.https://t.co/ItpuohI9eH
— Polymarket (@Polymarket) October 3, 2026
A few years ago, online retirement education platform Retirement Researcher examined the performance of the benchmark S&P 500 under four congressional scenarios from 1926 to 2023. While three were significant outperformers, one stood out for all the wrong reasons:
- Democratic president with a divided Congress: 16.63% average annual return over 15 years
- Unified Republican: 14.52% average annual return over 13 years
- Unified Democrat: 14.01% average annual return over 36 years
- Republican president with a divided Congress: 7.33% average annual return over 34 years
A "divided Congress" is one in which one or both houses are controlled by a party other than the one in the White House.
With an overwhelming majority of prediction market traders signaling that Democrats will retake at least one house of Congress on Nov. 3, the worst-case scenario for stocks is setting up: a Republican president overseeing a divided Congress.

Image source: Getty Images.
There's a silver lining to this dire forecast
Although a historical worst-case scenario is shaping up for the stock market over the next two years, it's important to put things into perspective.
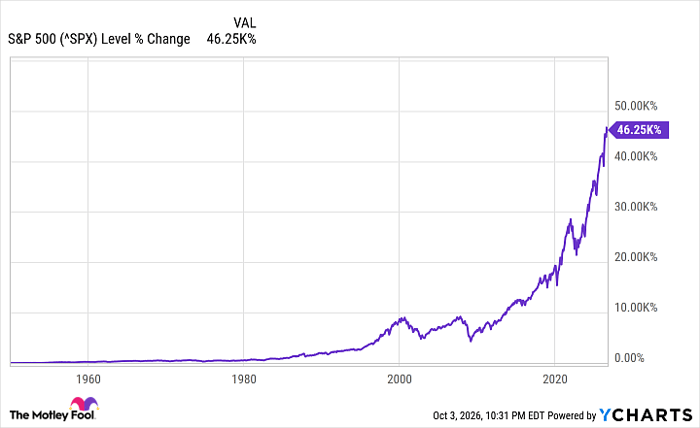
To begin with, a 7.33% average annual return is still considerably better than the average long-term returns from bonds, real estate, and commodities. While political gridlock in Congress may temper stock market returns for a bit, investing in equities remains the preferred course of action for long-term investors.
^SPX data by YCharts
Retirement Researcher's data also speaks to the resiliency of the stock market to thrive in all scenarios. It serves as a reminder that corporate earnings growth, innovation, capital-return programs, partnerships, and long-term outlooks are far more important to the Dow Jones Industrial Average, S&P 500, and Nasdaq Composite than a couple of years of potential gridlock in Congress.
The stock market may encounter an occasional speed bump, but traffic keeps moving no matter who's running the show.
Should you buy stock in S&P 500 Index right now?
Before you buy stock in S&P 500 Index, consider this:
The Motley Fool Stock Advisor analyst team just identified what they believe are the 10 best stocks for investors to buy now… and S&P 500 Index wasn’t one of them. The 10 stocks that made the cut could produce monster returns in the coming years.
Consider when Netflix made this list on December 17, 2004... if you invested $1,000 at the time of our recommendation, you’d have $375,887!* Or when Nvidia made this list on April 15, 2005... if you invested $1,000 at the time of our recommendation, you’d have $1,459,146!*
Now, it’s worth noting Stock Advisor’s total average return is 955% — a market-crushing outperformance compared to 215% for the S&P 500. Don't miss the latest top 10 list, available with Stock Advisor, and join an investing community built by individual investors for individual investors.
See the 10 stocks »
*Stock Advisor returns as of October 9, 2026.
Sean Williams has no position in any of the stocks mentioned. The Motley Fool has no position in any of the stocks mentioned. The Motley Fool has a disclosure policy.
Recommended Articles


