

Micron Stock Forecast: OpenAI Revenue Rumors Rattle AI Chip Sector, Can MU Stock Keep Rising?

Source Tradingkey

TradingKey - As of the market close on October 8 Eastern Time, Micron (MU) closed at $1,035.84, down 4.79%, with an intraday high of $1,088.50 and a low of $1,032.10, on a volume of about 29.91 million shares. Just prior to this on October 7, Micron had surged 4.06% to $1,088; the sharp volatility over two consecutive trading days indicates widening short-term bull-bear divergence.

Notably, the AI and semiconductor sectors were under overall pressure that day, with one focus of market attention coming from OpenAI. According to the Financial Times, as of the end of September, OpenAI's annualized revenue was around $50 billion, about $20 billion lower than the roughly $70 billion previously rumored in the market. However, differences in statistical methodology may exist between the two sets of figures, so this cannot be directly interpreted as a sudden decline in the company's revenue. Following the news, the market reassessed the alignment between AI infrastructure spending and actual revenue growth, causing Nvidia (NVDA), Oracle (ORCL), as well as some AI supply chain stocks including Micron, to fall on the day.
mu-1bfe7a83b0574b4f850912a35707870c

Daily chart of Micron stock, Source: TradingView

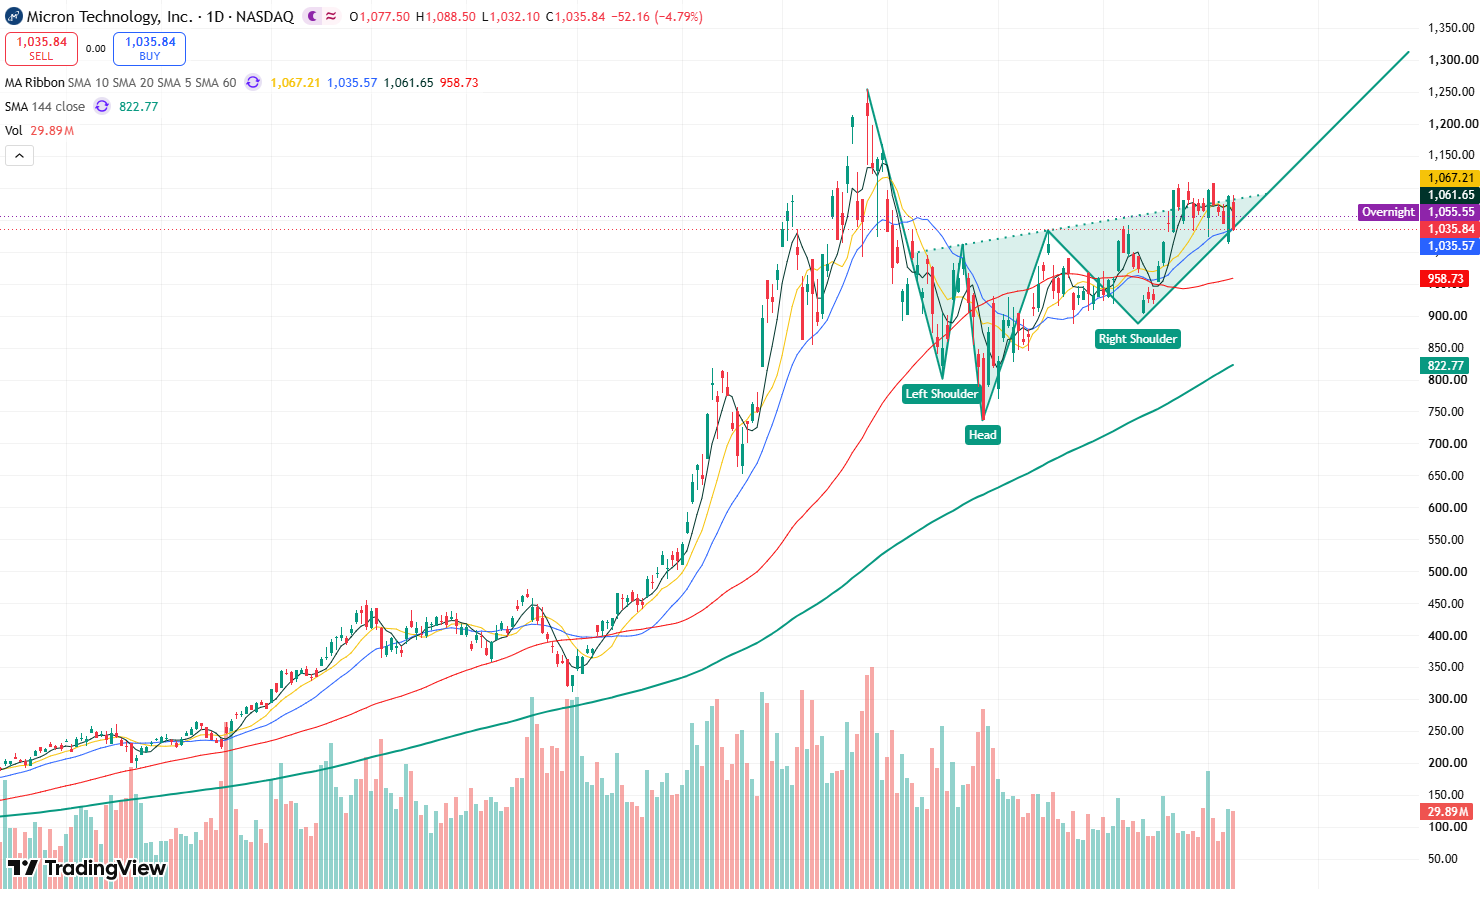
Looking at Micron's daily stock chart, since Micron surged 5% on September 22 and approached $1,100, the stock has repeatedly tested the $1,100 mark recently without a breakthrough, indicating heavy short-term resistance at this level. If the stock is to open up further upside room, it first needs to break through and hold above $1,100 on heavy volume.

In terms of technical indicators, the 14-day RSI stands around 51.2, remaining in the neutral-to-bullish zone, indicating that overall market sentiment still favors the bulls. Meanwhile, although the stock fell 4.79% yesterday, it has not broken below the 20-day moving average, demonstrating a degree of support at this level.

Currently, the overall candlestick chart continues to maintain a head-and-shoulders bottom pattern, with the overall trend still biased upward. The primary resistance level on the upside to watch is $1,100; if broken, the stock will open up room for further upside toward $1,200, with the previous all-time high of $1,255 lying further above.

On the downside, the key support level to watch below is the $1,000 mark. If this level fails to hold, the stock may further test $960, with the $900 level situated further down.

Disclaimer: For information purposes only. Past performance is not indicative of future results.
placeholder
Gold prices rise to over one-month high on softer dollar, bond yieldsGold prices climbed on Tuesday to their highest point in more than a month, supported by a weaker U.S. dollar and lower Treasury yields.
Author  Reuters
Jul 22, 2025
Gold prices climbed on Tuesday to their highest point in more than a month, supported by a weaker U.S. dollar and lower Treasury yields.
placeholder
Gold holds steady below $4,150 amid elevated US yields Gold price (XAU/USD) trades on a flat note near $4,140 during the early Asian session on Tuesday. Pressure from a stronger US Dollar (USD) and elevated US Treasury yields was offset by reduced expectations of a Federal Reserve (Fed) rate hike this month.
Author  FXStreet
Oct 06, Tue
Gold price (XAU/USD) trades on a flat note near $4,140 during the early Asian session on Tuesday. Pressure from a stronger US Dollar (USD) and elevated US Treasury yields was offset by reduced expectations of a Federal Reserve (Fed) rate hike this month.
placeholder
WTI rises to near $89.50 as Middle East supply threats offset Persian Gulf recoveryWest Texas Intermediate (WTI) oil price extends its gains for the second successive day, trading around $89.50 per barrel during the Asian hours on Wednesday. Crude oil climbed as persistent risks to Middle East energy flows overshadowed signs of rising supply from the region.
Author  FXStreet
Oct 07, Wed
West Texas Intermediate (WTI) oil price extends its gains for the second successive day, trading around $89.50 per barrel during the Asian hours on Wednesday. Crude oil climbed as persistent risks to Middle East energy flows overshadowed signs of rising supply from the region.
placeholder
Gold falls to a two-month low as real yields bite — can $4,000 hold?Gold hit a two-month low on 7 October, with spot touching roughly $4,090 and COMEX December futures closing at $4,140.70, even as the New York Fed's one-year inflation expectation rose to 3.9% — its highest since May 2023. The paradox resolves through real yields: the 30-year Treasury yield reached 5.732% intraday, its highest since 2002. Here are the levels, the institutional split, and the scenarios into tonight's jobless claims and 30-year auction.
Author  Irene Q.
Yesterday 07: 32
Gold hit a two-month low on 7 October, with spot touching roughly $4,090 and COMEX December futures closing at $4,140.70, even as the New York Fed's one-year inflation expectation rose to 3.9% — its highest since May 2023. The paradox resolves through real yields: the 30-year Treasury yield reached 5.732% intraday, its highest since 2002. Here are the levels, the institutional split, and the scenarios into tonight's jobless claims and 30-year auction.
placeholder
【Daily Brief】Gold rebounds 1% off a two-month low, Nasdaq drops 1.25% and yields ease — the storm premium keeps WTI near $91Gold trades at $4,174 after rebounding from Wednesday's $4,090 two-month low, the Nasdaq fell 1.25% while the Dow edged higher, and the 10-year Treasury eased to 5.23% from the week's highs. Hurricane Isaias keeps about 25% of Gulf output shut in with WTI near $91, and bitcoin holds below $82,000. The next scheduled tests are the EIA report on 15 October and the FOMC on 27-28 October.
Author  Irene Q.
8 hours ago
Gold trades at $4,174 after rebounding from Wednesday's $4,090 two-month low, the Nasdaq fell 1.25% while the Dow edged higher, and the 10-year Treasury eased to 5.23% from the week's highs. Hurricane Isaias keeps about 25% of Gulf output shut in with WTI near $91, and bitcoin holds below $82,000. The next scheduled tests are the EIA report on 15 October and the FOMC on 27-28 October.
goTop
quote