


S&P 500 vs. Nasdaq 100: Which Is Better for Long-Term Investment?
TradingKey - For long-term investors in U.S. stocks, both the S&P 500 and the Nasdaq 100 cover Apple (AAPL), Microsoft (AMZN), Nvidia (NVDA), and other large U.S. companies, but they exhibit clear differences in sector distribution, long-term returns, and risk profiles. So, which of these two indices is more worth investing in?
What Is the Difference Between the S&P 500 and Nasdaq 100?
The S&P 500 includes approximately 500 large U.S. publicly traded companies, covering about 80% of the U.S. investable stock market capitalization. Spanning sectors such as technology, finance, healthcare, industrials, consumer goods, and energy, it is widely regarded as a core index for measuring the performance of the U.S. large-cap market.
The Nasdaq 100 consists of the 100 largest non-financial companies listed on the Nasdaq exchange and employs a modified market-cap weighting scheme. Compared with the S&P 500, the Nasdaq 100 has a significantly higher technology sector weight and completely excludes financial stocks, giving it a stronger overall growth profile than the S&P 500.
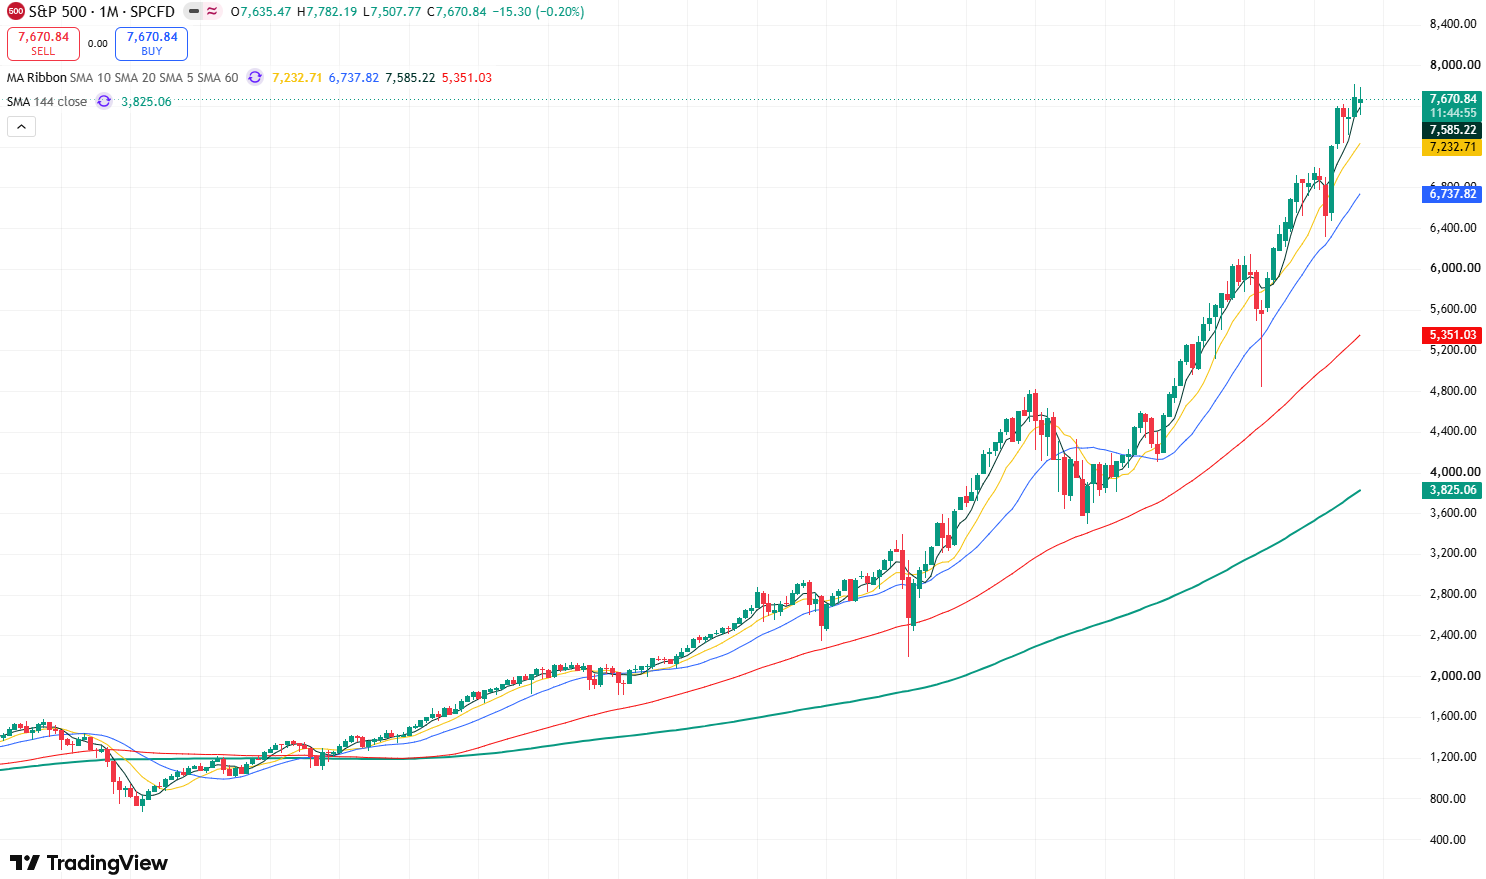
S&P 500 Index monthly chart, Source: TradingView
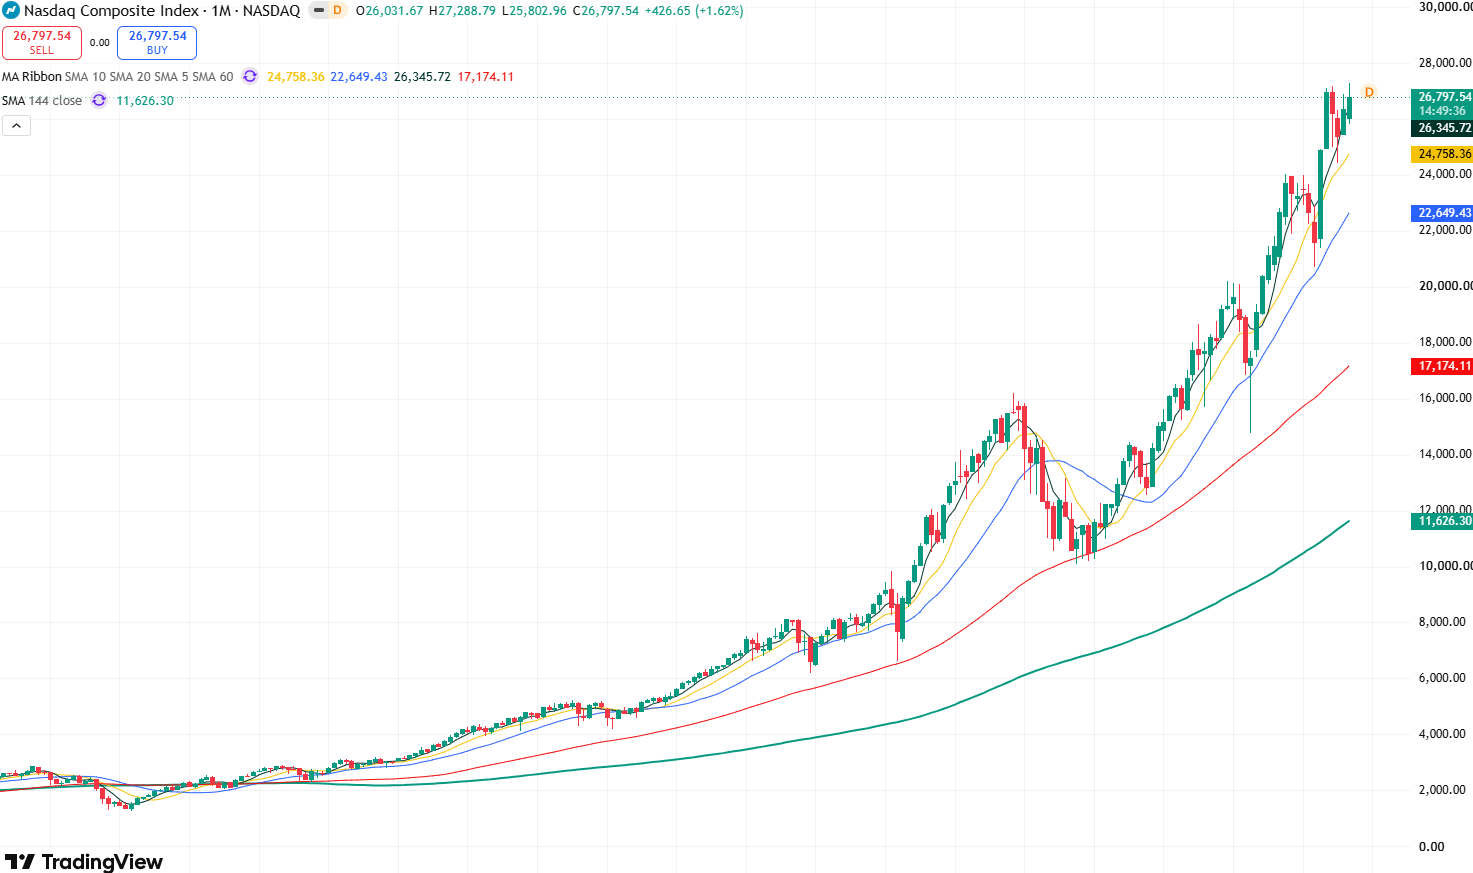
Nasdaq 100 Index monthly chart, Source: TradingView
S&P 500 vs. Nasdaq 100: Which Offers Higher Long-Term Returns?
Looking at long-term performance, the Nasdaq 100 holds a clear advantage.
According to Nasdaq data, from the end of 2007 through the end of 2025, the cumulative total return of the Nasdaq 100 reached approximately 1,342%, compared with about 560% for the S&P 500 over the same period, corresponding to annualized returns of approximately 16.0% and 11.0%, respectively.
This means that based solely on historical performance over the past nearly 20 years, the Nasdaq 100 significantly outperformed the S&P 500. A key reason behind this was the rapid expansion of mega-cap technology and growth companies such as Apple, Microsoft, Nvidia, and Amazon (AMZN), while cloud computing, smartphones, the internet, and the recent AI wave continuously drove up tech companies' earnings and valuations.
However, higher past returns do not guarantee continued outperformance in the future. The past decade or so coincided with a period of rapid growth for major U.S. tech companies. If tech industry growth slows, valuations decline, or market style shifts toward traditional industries in the future, the return gap between the two indexes could also change.
Nasdaq 100 Offers Higher Returns, But Also Higher Risk
It is worth noting that higher returns are usually accompanied by greater volatility. From the end of 2007 to the end of 2025, the annualized volatility of the Nasdaq 100 was approximately 22.9%, compared with about 20.1% for the S&P 500. Because the Nasdaq 100 is more heavily concentrated in tech and growth stocks, its declines tend to be more pronounced when the market enters a rate-hike cycle or when tech stock valuations undergo a major adjustment. For example, during the Federal Reserve's rapid rate hikes in 2022, high-valuation tech stocks suffered a concentrated sell-off, and the Nasdaq 100 fell significantly more than the S&P 500.
By contrast, the S&P 500 encompasses a broader range of sectors, including financials, healthcare, industrials, energy, and consumer staples, which can to some extent mitigate the impact of adjustments in any single sector. Therefore, the greatest advantage of the S&P 500 lies in its superior sector diversification.
S&P 500 or Nasdaq 100 for Long-Term Investment?
For investors looking to share in the long-term growth of the U.S. economy and corporate earnings while mitigating single-sector risk, the S&P 500 is better suited as a core asset for long-term investing. The index features broader coverage and a more balanced sector allocation, typically offering a relatively stable long-term holding experience.
For investors who are more bullish on the long-term growth of AI, semiconductors, cloud computing, and mega-cap tech companies, and can tolerate larger drawdowns, the Nasdaq 100 may be more appealing. Historical data shows its long-term returns significantly outperform the S&P 500, though investors must also accept higher sector concentration and valuation risks.
Therefore, for average long-term investors, the S&P 500 is more suitable as a foundational allocation; for investors with higher risk tolerance who remain bullish on long-term tech and AI industry trends, the Nasdaq 100 can offer greater growth upside.
Recommended Articles


