


Nebius vs. CoreWeave: Which Is the Better AI Stock to Own for the Next 5 Years?
Key Points
Nebius and CoreWeave are growing rapidly, but both are spending billions to build capacity.
Debt and long-term leases add risk to each company’s expansion.
Nebius is much more expensive by price-to-sales, yet I think it’s the better investment.
- 10 stocks we like better than Nebius Group ›
The AI infrastructure boom has produced a lot of winners, but few stocks have run as hard as Nebius Group (NASDAQ: NBIS) and CoreWeave (NASDAQ: CRWV). Both of these so-called neoclouds are racing to meet the seemingly endless demand for AI computing power, and both are relying on a similar model to do so.
So, which one has the edge?
Missed AI’s "Act 1"? Act 2 Could Be 15x Bigger. Most investors think they missed the AI boat because they didn't buy Nvidia in 2005. But according to our analysts, we’re only at the end of "Act 1"—the R&D phase. "Act 2" is the global rollout. Continue »
What is a neocloud?
First, what exactly is a "neocloud"? What do these companies actually do?
The answer is fairly straightforward. The primary (simplified) model for Nebius, CoreWeave, and those like it is: Buy advanced artificial intelligence (AI)-focused chips, install them in data centers, and then rent out that computing power -- or "compute" -- to the companies that actually build and run the AI models and applications.
One primary difference between the two companies is data center ownership. CoreWeave relies much more heavily on leasing space from others and has only recently moved toward incorporating ownership in the mix, while Nebius is heavily weighted toward owning the data centers it operates.

Image source: Getty Images.
Nebius is building rapidly
Business is booming for Nebius, with revenue jumping 454% year over year in its most recent quarter, reaching $582 million. The company is now making roughly 5,940% of its 2023 revenue in a single quarter.
That sort of growth has led to a stunning rally for Nebius stock, which is up roughly 1,150% since 2022.
Of course, things look a bit different on the bottom line, where Nebius is still struggling to turn a consistent profit. In its last quarter, the company's net loss swung to $190.4 million. Unsurprisingly, things look even worse on a cash basis. Nebius made $5.7 billion in capital expenditures (capex) last quarter alone. A year earlier, that figure was about $500 million.
Nebius's free cash flow (FCF) -- the cash left over after running the business and its capex investments -- was negative $3.4 billion last quarter.
CoreWeave: Growing, but still in the red
CoreWeave's success has followed a similar script. The company reported sales of $2.58 billion last quarter, up from $1.21 billion in the same period last year.
Like Nebius, CoreWeave stock has exploded in the last few years, rising roughly 114% from its in initial public offering in 2025 to today.
CoreWeave has yet to turn a profit. It reported a loss of $626 million last quarter, deeper than the net loss of $290 million during the same period last year. CoreWeave's FCF fell to negative $5.7 billion after its capex spend jumped to $6.4 billion.
How the neoclouds pay for it
So how are these companies funding their vast capital outlays? Primarily through a mix of stock sales and debt. Given that neither of these companies has the balance sheets, cash flows, and general financial resources of their hyperscale counterparts, the basic neocloud model is heavily reliant on borrowed money. Take a look at the growth of long-term debt for each company below.
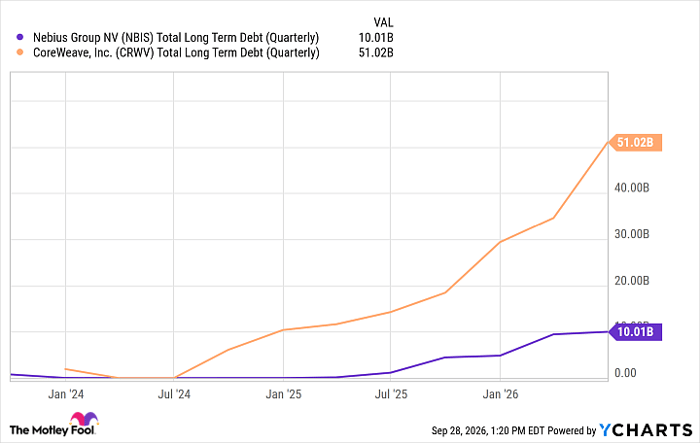
NBIS Total Long Term Debt (Quarterly) data by YCharts.
Keep in mind that this debt doesn't include another $15.7 billion in long-term lease agreements for CoreWeave and $1.5 billion for Nebius.
Valuation and which stock has the edge
If we're evaluating these not just as companies, but as investments, we have to talk about valuation. Since both companies are still operating in the red, a typical price-to-earnings ratio (P/E) doesn't really apply. So, we'll have to look at price-to-sales (P/S).
Right now, Nebius stock trades at 46 times sales, while CoreWeave trades at just under 6 times sales.
Honestly, I see Nebius as being in a better position operationally as a business. I think it has the better model. I think CoreWeave's financial position is more precarious, and its extreme reliance on debt could come back to bite it.
As an investment, it's a harder call. The valuation mismatch is pretty extreme. I still think Nebius is the better pick, with more opportunity to actually grow into its valuation.
However, I would caution investors from making either stock more than a tiny portion of a balanced portfolio. There is a lot of risk in both.
Should you buy stock in Nebius Group right now?
Before you buy stock in Nebius Group, consider this:
The Motley Fool Stock Advisor analyst team just identified what they believe are the 10 best stocks for investors to buy now… and Nebius Group wasn’t one of them. The 10 stocks that made the cut could produce monster returns in the coming years.
Consider when Netflix made this list on December 17, 2004... if you invested $1,000 at the time of our recommendation, you’d have $375,240!* Or when Nvidia made this list on April 15, 2005... if you invested $1,000 at the time of our recommendation, you’d have $1,403,292!*
Now, it’s worth noting Stock Advisor’s total average return is 932% — a market-crushing outperformance compared to 211% for the S&P 500. Don't miss the latest top 10 list, available with Stock Advisor, and join an investing community built by individual investors for individual investors.
See the 10 stocks »
*Stock Advisor returns as of October 2, 2026.
Johnny Rice has no position in any of the stocks mentioned. The Motley Fool has no position in any of the stocks mentioned. The Motley Fool has a disclosure policy.
Recommended Articles


