


AMD Stock Forecast: Market Cap Tops $1 Trillion for First Time, Can AI Agent Demand Keep Driving Stock Higher?
TradingKey - As of the close on September 21 Eastern Time, AMD (AMD) surged 9.95% to close at $615.52, reaching an intraday high of $616.69, setting a new all-time high and pushing the company's market capitalization past $1 trillion for the first time. Over the past week, AMD gained about 25%, with its year-to-date gain approaching 190%, significantly outperforming the Nasdaq Index.
Muse Drives CPU Demand Expectations as AI Inference Becomes New Catalyst for AMD
From a fundamental perspective, the core driver behind AMD's sharp stock rally is the rapid surge in popularity of Meta's (META) newly launched AI Agent, Muse. Muse has topped the US App Store free app chart for several consecutive days, and its continuous-online, multitasking execution mode has reinforced market expectations of rapidly growing demand for AI inference computing power. Unlike the training phase, which relies primarily on GPUs, executing tasks with a large number of agents also requires server CPU involvement. Consequently, CPU makers such as AMD and Intel (INTC) have become key targets of capital allocation in this round of trading.
From AMD's financial results, the company's second-quarter revenue reached $11.5 billion, up 50% year-over-year, with data center revenue reaching $6.7 billion, up 107% year-over-year, mainly driven by demand for EPYC server processors and Instinct MI350 GPUs. AMD expects third-quarter revenue of approximately $13 billion, representing year-over-year growth of about 41%. Recently, the company also released benchmark data for its next-generation EPYC "Venice" processors and continues to advance its layout in Instinct, Helios, and AI inference chips.
Therefore, AMD's current growth logic is no longer just about challenging Nvidia in the GPU market, but also encompasses server CPUs, AI accelerators, and complete AI systems. However, following the rapid rise in stock price, market expectations for future performance have also increased significantly. If AI demand does not translate into sustained upward revisions in revenue and profit, high valuations could increase stock price volatility.
AMD Stock Technical Analysis
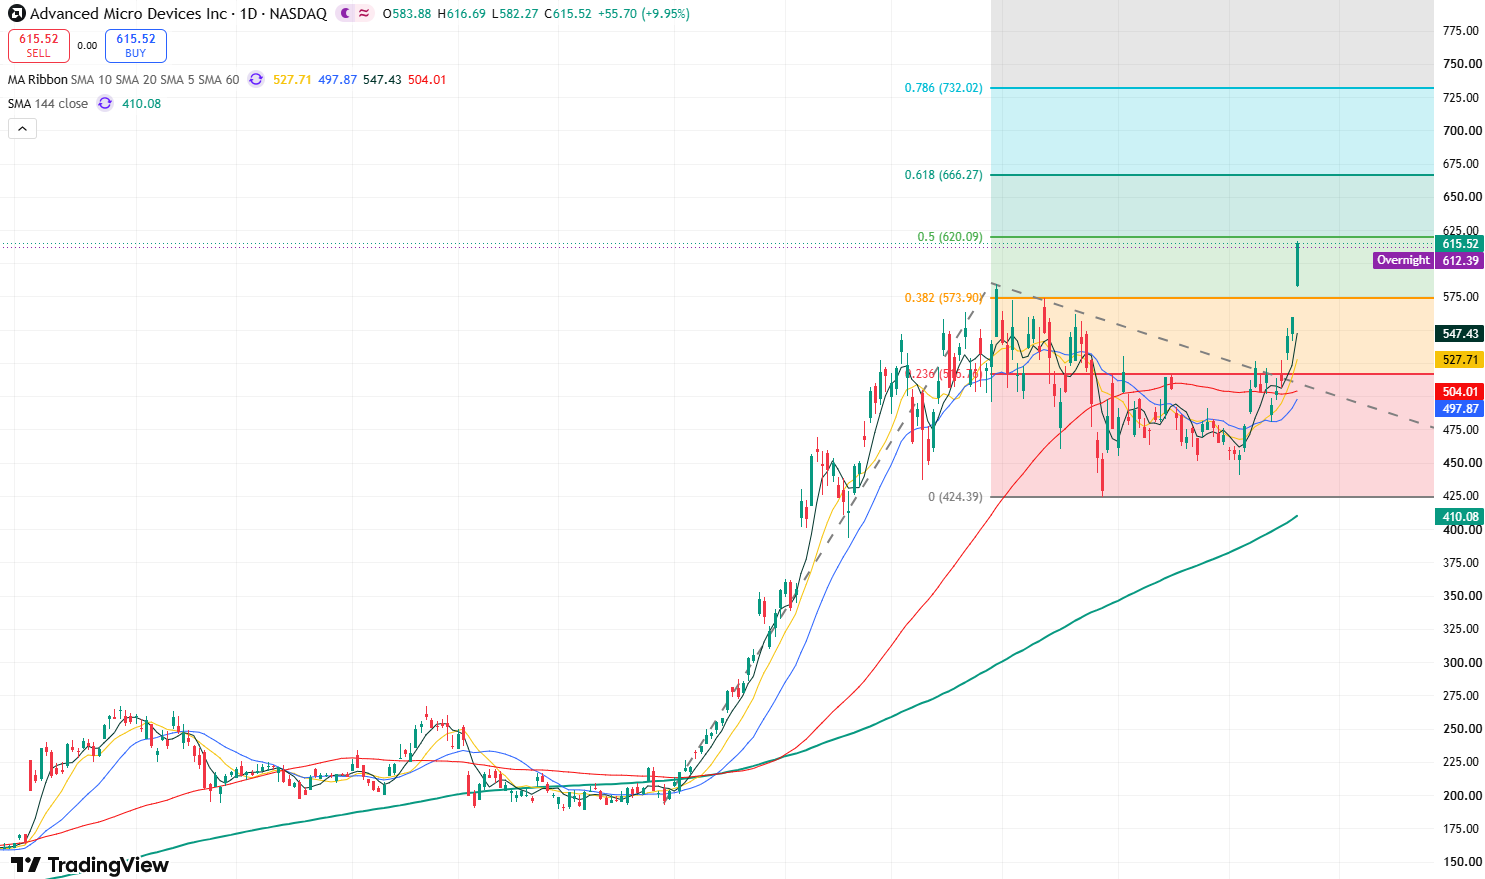
AMD stock daily chart, Source: TradingView
Based on the daily chart of AMD's stock price, the stock is currently in a strong breakout phase. On September 14, the stock price dipped to $480.33 before staging a continuous rebound. On September 21, it jumped further from $559.82 to $615.52, with trading volume expanding to approximately 43.27 million shares, significantly above the recent average. The previous resistance near $584.73 has been broken on heavy volume, further strengthening the technical setup.
Currently, the stock price has set a new record high of $616.89. On the upside, the primary resistance level to watch is the 0.5 Fibonacci extension level at $620. A breakout above this level would open up upside room toward around $660; if the stock price breaks further above this point, the next upside target could reach around $730.
On the downside, initial focus should be on $580–$585, which is close to the platform prior to this breakout, with further support located at $550–$560. If AMD pulls back but manages to hold near $580, the current breakout structure will remain intact; if it falls back below $550, caution is warranted as the rapid rally could enter a more pronounced technical correction.
Recommended Articles


