


Will President Trump Crash the Stock Market? History Says This Could Come Next.
Key Points
The Trump administration has shown a willingness to use the U.S. economy as a geopolitical cudgel.
How much longer can stocks shrug off the geopolitical uncertainty?
- 10 stocks we like better than S&P 500 Index ›
Donald Trump's return to the White House sparked a new period of uncertainty as investors must now navigate the impacts of his unorthodox and often contradictory policy initiatives. The S&P 500 so far has largely shrugged off these challenges with a gain of 17.9% in 2025 and just over 11% so far this year as optimism over the generative artificial intelligence (AI) boom continues to dominate the narrative.
How much longer can stocks ignore the elephant in the room? Let's dig deeper into the challenges facing the current market -- referencing historical parallels to try to figure out what might come next for investors.
Missed AI’s "Act 1"? Act 2 Could Be 15x Bigger. Most investors think they missed the AI boat because they didn't buy Nvidia in 2005. But according to our analysts, we’re only at the end of "Act 1"—the R&D phase. "Act 2" is the global rollout. Continue »
An inflationary administration
While the Trump administration continues to claim that it wants to lower prices, its policy decisions are having the opposite effect. The biggest challenge comes from the war in Iran, which has led to severe disruptions in the Strait of Hormuz, a chokepoint responsible for the transit of about 25% of global maritime oil shipment volume. The situation is similar to the oil shocks of 1973 and 1979, when disruptions in Middle Eastern supply led to a mix of slow U.S. growth and rising inflation, often referred to as stagflation.
The situation worsened this month, when Iran-backed militants opened another front near the Strait of Bab al-Mandeb, responsible for around 11% of maritime oil volumes. Brent crude prices are up 72% year to date, helping spark inflationary pressure throughout the U.S. economy.
Trump's aggressive trade policy could worsen the inflation situation. While the Supreme Court struck down many of his most extreme "Liberation Day" tariffs, the president continues to seek to implement tariffs through other legal justifications. And on Sept. 17, the administration got a huge win when the House of Representatives cleared a bill that could allow tariffs of up to 100% on countries that are top purchasers of Russian oil. This could raise consumer prices while further disrupting the oil market.
Can inflation kill the AI boom?
While the rising fuel costs and inflation could be devastating for regular consumers, they probably won't have a direct impact on stock market performance. According to analysts at Goldman Sachs, half of the S&P 500's earnings growth is now coming from spending related to artificial intelligence (AI). Hyperscalers are spending hundreds of billions to buy data center infrastructure, sending chipmaker profits through the roof.
But while big AI spenders like Amazon, Microsoft, and Meta Platforms are somewhat insulated from the fallout from Trump's policy, they aren't immune to its indirect impacts, like rising interest rates and bond yields.
This month, the Federal Reserve increased its benchmark interest rate by 0.25% to between 3.75% and 4%, the first hike in three years. Higher rates mean higher borrowing costs, which come at a very bad time for tech companies that are expected to pour more than $1 trillion into AI-related projects this year alone.
Political uncertainty is also causing the yields on U.S. government debt to rise. And with the 10-year Treasury offering a very attractive risk-free return of 4.94%, investors will be less willing to take on AI-related risk, potentially putting pressure on company valuations and slowing investment throughout the economy.
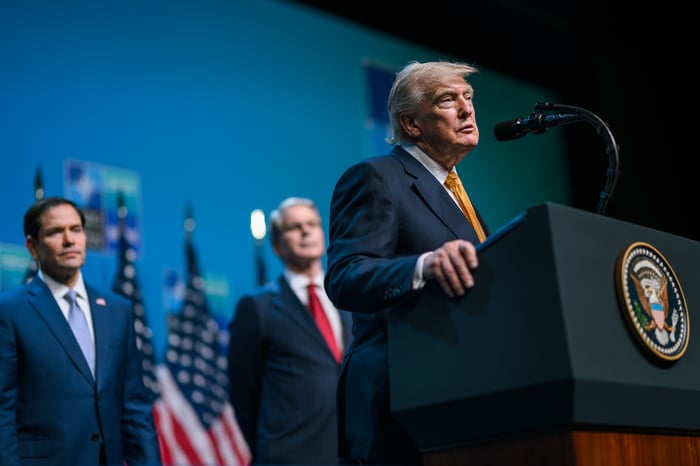
President Donald Trump. Image source: The White House.
What does history suggest?
Consecutive years of above-average growth in the S&P 500 are typically followed by a decline. And the cyclically adjusted price-to-earnings (CAPE) ratio now stands at almost 41, a level unseen since the dot-com bubble in 1999, which was followed by a major stock market decline.
Of course, timing the market is notoriously difficult. And with interest rates relatively high, the Fed has room to stimulate the economy through cuts if things get really hairy. Instead of selling everything and sitting on the sidelines, investors should consider pivoting away from richly valued growth stocks toward value-oriented companies that don't have much room to fall if the AI bubble bursts.
Should you buy stock in S&P 500 Index right now?
Before you buy stock in S&P 500 Index, consider this:
The Motley Fool Stock Advisor analyst team just identified what they believe are the 10 best stocks for investors to buy now… and S&P 500 Index wasn’t one of them. The 10 stocks that made the cut could produce monster returns in the coming years.
Consider when Netflix made this list on December 17, 2004... if you invested $1,000 at the time of our recommendation, you’d have $387,158!* Or when Nvidia made this list on April 15, 2005... if you invested $1,000 at the time of our recommendation, you’d have $1,365,749!*
Now, it’s worth noting Stock Advisor’s total average return is 932% — a market-crushing outperformance compared to 211% for the S&P 500. Don't miss the latest top 10 list, available with Stock Advisor, and join an investing community built by individual investors for individual investors.
See the 10 stocks »
*Stock Advisor returns as of September 20, 2026.
Will Ebiefung has no position in any of the stocks mentioned. The Motley Fool has positions in and recommends Amazon, Goldman Sachs Group, Meta Platforms, and Microsoft. The Motley Fool has a disclosure policy.
Recommended Articles


