


Markel Is Built Like a Smaller Berkshire Hathaway. Its Stock Sits 18% Below Its 52-Week High.
Key Points
Markel is an insurance company that also owns a portfolio of stocks and controlled businesses.
Like Berkshire Hathaway, investors need to think long term when they consider Markel.
- 10 stocks we like better than Markel Group ›
Berkshire Hathaway (NYSE: BRKA)(NYSE: BRKB) has a market cap of $1.1 trillion. Markel's (NYSE: MKL) market cap is "just" $22 billion. This comparison is important because Markel is open about the fact that it is copying Berkshire Hathaway's business model, leading many to describe it as baby Berkshire. With Markel down around 18% from its 52-week high, as of this writing, and Berkshire Hathaway only down around 2%, should investors buy Markel?
What does Markel do?
Like Berkshire Hathaway, Markel's core business is insurance. Both companies have taken an aggressive view of the float. The float is made up of the premiums that Markel collects and holds until they are needed to pay claims. While most insurance companies focus on buying bonds, Berkshire and Markel use the float to buy entire companies and invest in select publicly traded stocks.
Missed Nvidia in 2009? This Rare Signal Is Flashing Again. In 2009, a "Double Down" signal flashed for a little-known chipmaker called Nvidia. For the first time in years, that same "Total Conviction" signal is flashing for a company 1/100th the size of Nvidia. Continue »

Image source: Getty Images.
Equities make up around $13.4 billion of Markel's $33.5 billion investment portfolio, as of the second quarter of 2026. The key here is that the cost basis of its equity investments is only about $4.2 billion, so the company has created a lot of value for shareholders with just its stock investments alone. And that doesn't even take into consideration the operating businesses it owns across the industrial, consumer, and "other" spaces. Markel's goal is to support and grow these businesses over the long term, adding even more value for shareholders.
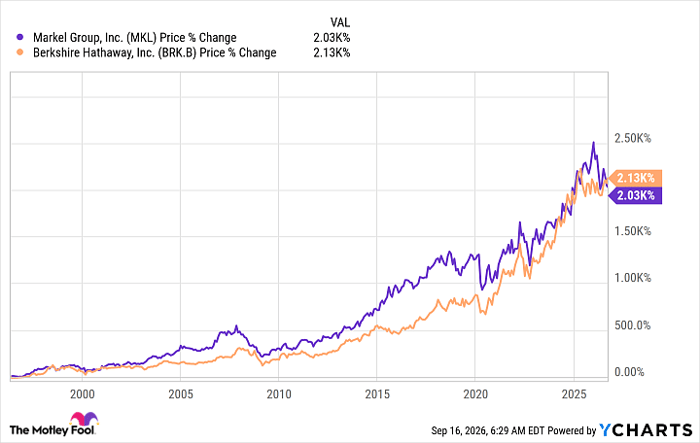
MKL data by YCharts
For many years, Markel's stock actually outperformed Berkshire Hathaway's. However, the recent pullback has left Berkshire Hathaway ahead. Only, both companies have gone through material transitions. Berkshire Hathaway's world-famous CEO, Warren Buffett, handed over the CEO job to hand-picked lieutenant Greg Abel at the start of 2026. And Markel spent some time repositioning its business ahead of 2026, fine-tuning its strategy and simplifying its reporting structure. So both businesses are still doing the same basic thing, but not exactly in the same way.
Markel is a unique long-term investment with a strong history
Like Berkshire Hathaway, Markel is a fairly complex company to track because there are so many moving parts. Historically, the Berkshire Hathaway-styled approach has proven a winner for investors, so the pullback is probably worth looking into. However, that's really only true if you are looking to invest for the long term and look at Markel as something of a mutual fund-like investment.
All in, you are investing alongside Markel as it invests in other businesses and stocks. Historically, that's worked out well for shareholders, even though past performance isn't a guarantee of future results. For investors who like to do their own research, Markel probably won't be a good fit.
Should you buy stock in Markel Group right now?
Before you buy stock in Markel Group, consider this:
The Motley Fool Stock Advisor analyst team just identified what they believe are the 10 best stocks for investors to buy now… and Markel Group wasn’t one of them. The 10 stocks that made the cut could produce monster returns in the coming years.
Consider when Netflix made this list on December 17, 2004... if you invested $1,000 at the time of our recommendation, you’d have $420,109!* Or when Nvidia made this list on April 15, 2005... if you invested $1,000 at the time of our recommendation, you’d have $1,303,689!*
Now, it’s worth noting Stock Advisor’s total average return is 938% — a market-crushing outperformance compared to 211% for the S&P 500. Don't miss the latest top 10 list, available with Stock Advisor, and join an investing community built by individual investors for individual investors.
See the 10 stocks »
*Stock Advisor returns as of September 17, 2026.
Reuben Gregg Brewer has no position in any of the stocks mentioned. The Motley Fool has positions in and recommends Berkshire Hathaway and Markel Group. The Motley Fool has a disclosure policy.
Recommended Articles


