


Ripple Price Forecast: XRP eyes $1.40 rebound as ETF inflows steady
- XRP builds momentum above $1.35 support as bulls target $1.40 breakout.
- Steady XRP spot ETFs’ inflows fuel the token’s short-term recovery outlook.
- The RSI trends upward alongside XRP’s rebound, but the MACD indicator maintains a sell signal that could cap potential gains.
Ripple (XRP) is holding support at $1.35 at the time of writing on Monday, as crypto prices broadly recover amid optimism for a US-Iran ceasefire deal. XRP’s momentum, although subtle, aligns with steady demand through related investment products.
The US and Iran are reportedly approaching a critical 60-day ceasefire deal that will pave the way for a gradual reopening of the Strait of Hormuz, the end of the blockade on Iranian ports, and a nuclear deal.
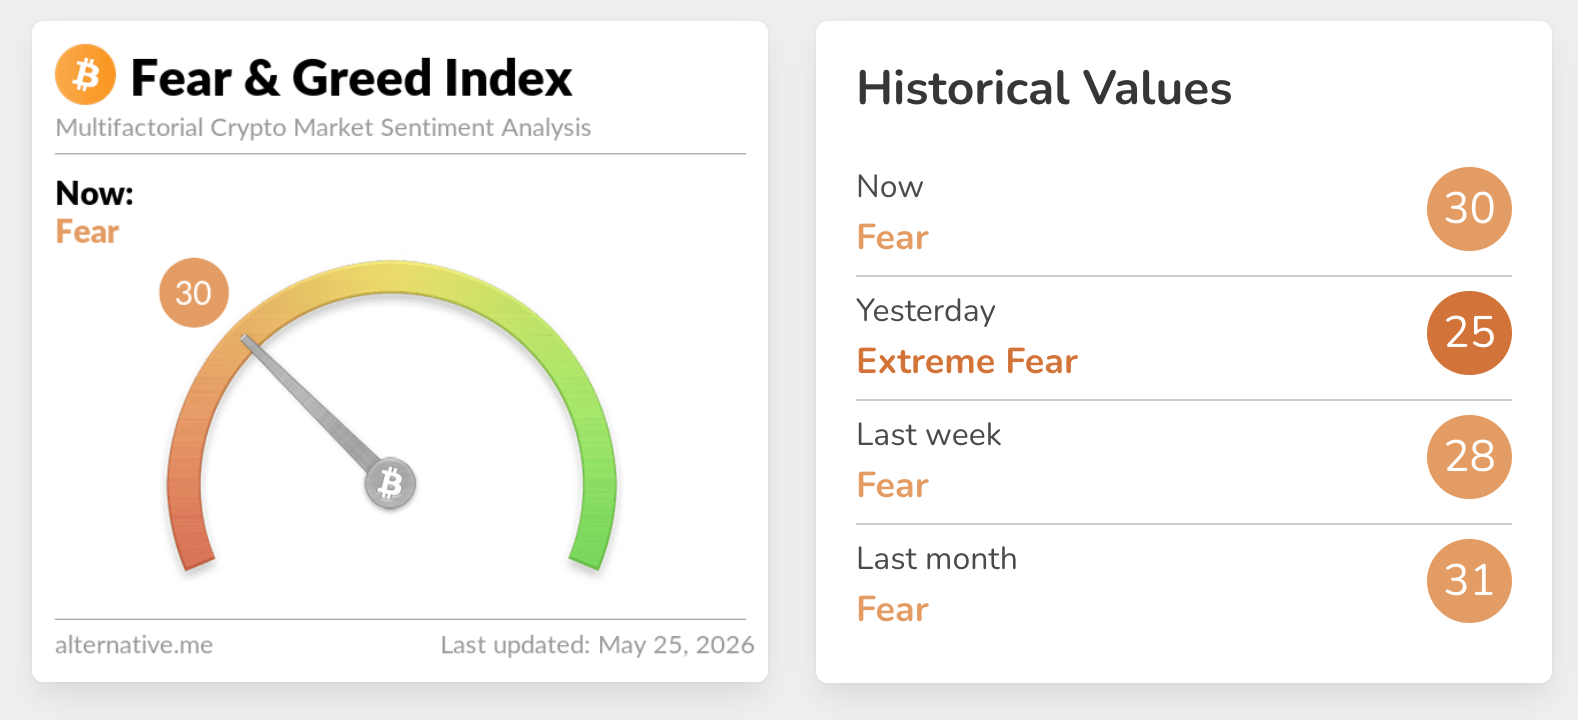
West Texas Intermediate (WTI) Oil prices eased further below $90, reflecting broadly improving sentiment. As for crypto, the Fear & Greed Index has improved to 30 in the Fear Territory on Monday, up from 25 in the Extreme Fear zone. A sustained improvement in sentiment underpins risk-on sentiment and steady price increases.
XRP gains momentum as institutional inflows stabilize
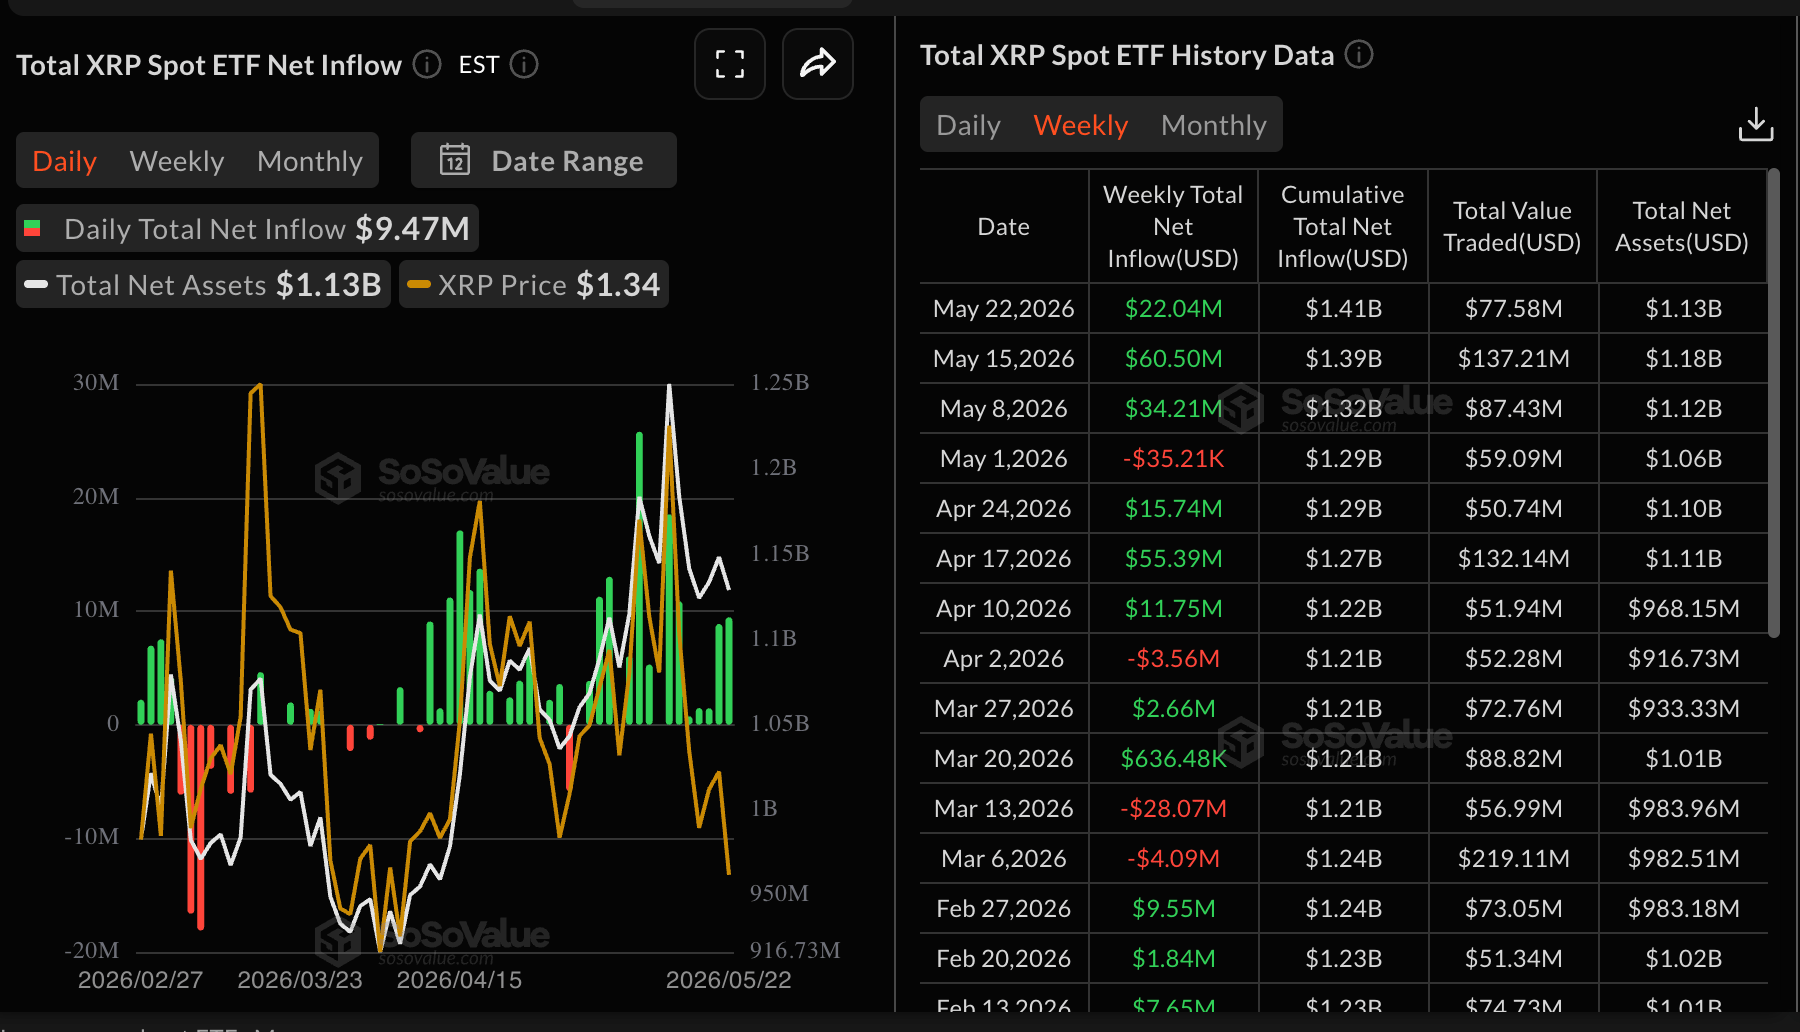
Institutional investors have for three weeks sought to increase risk exposure through spot Exchange-Traded Funds (ETFs). SoSoValue data shows that fund inflows totaled approximately $22 million last week, following $61 million the week prior and $34 million for the week ending May 8. The relatively steady demand backs risk-on sentiment toward XRP, raising the odds of a sustained rebound.
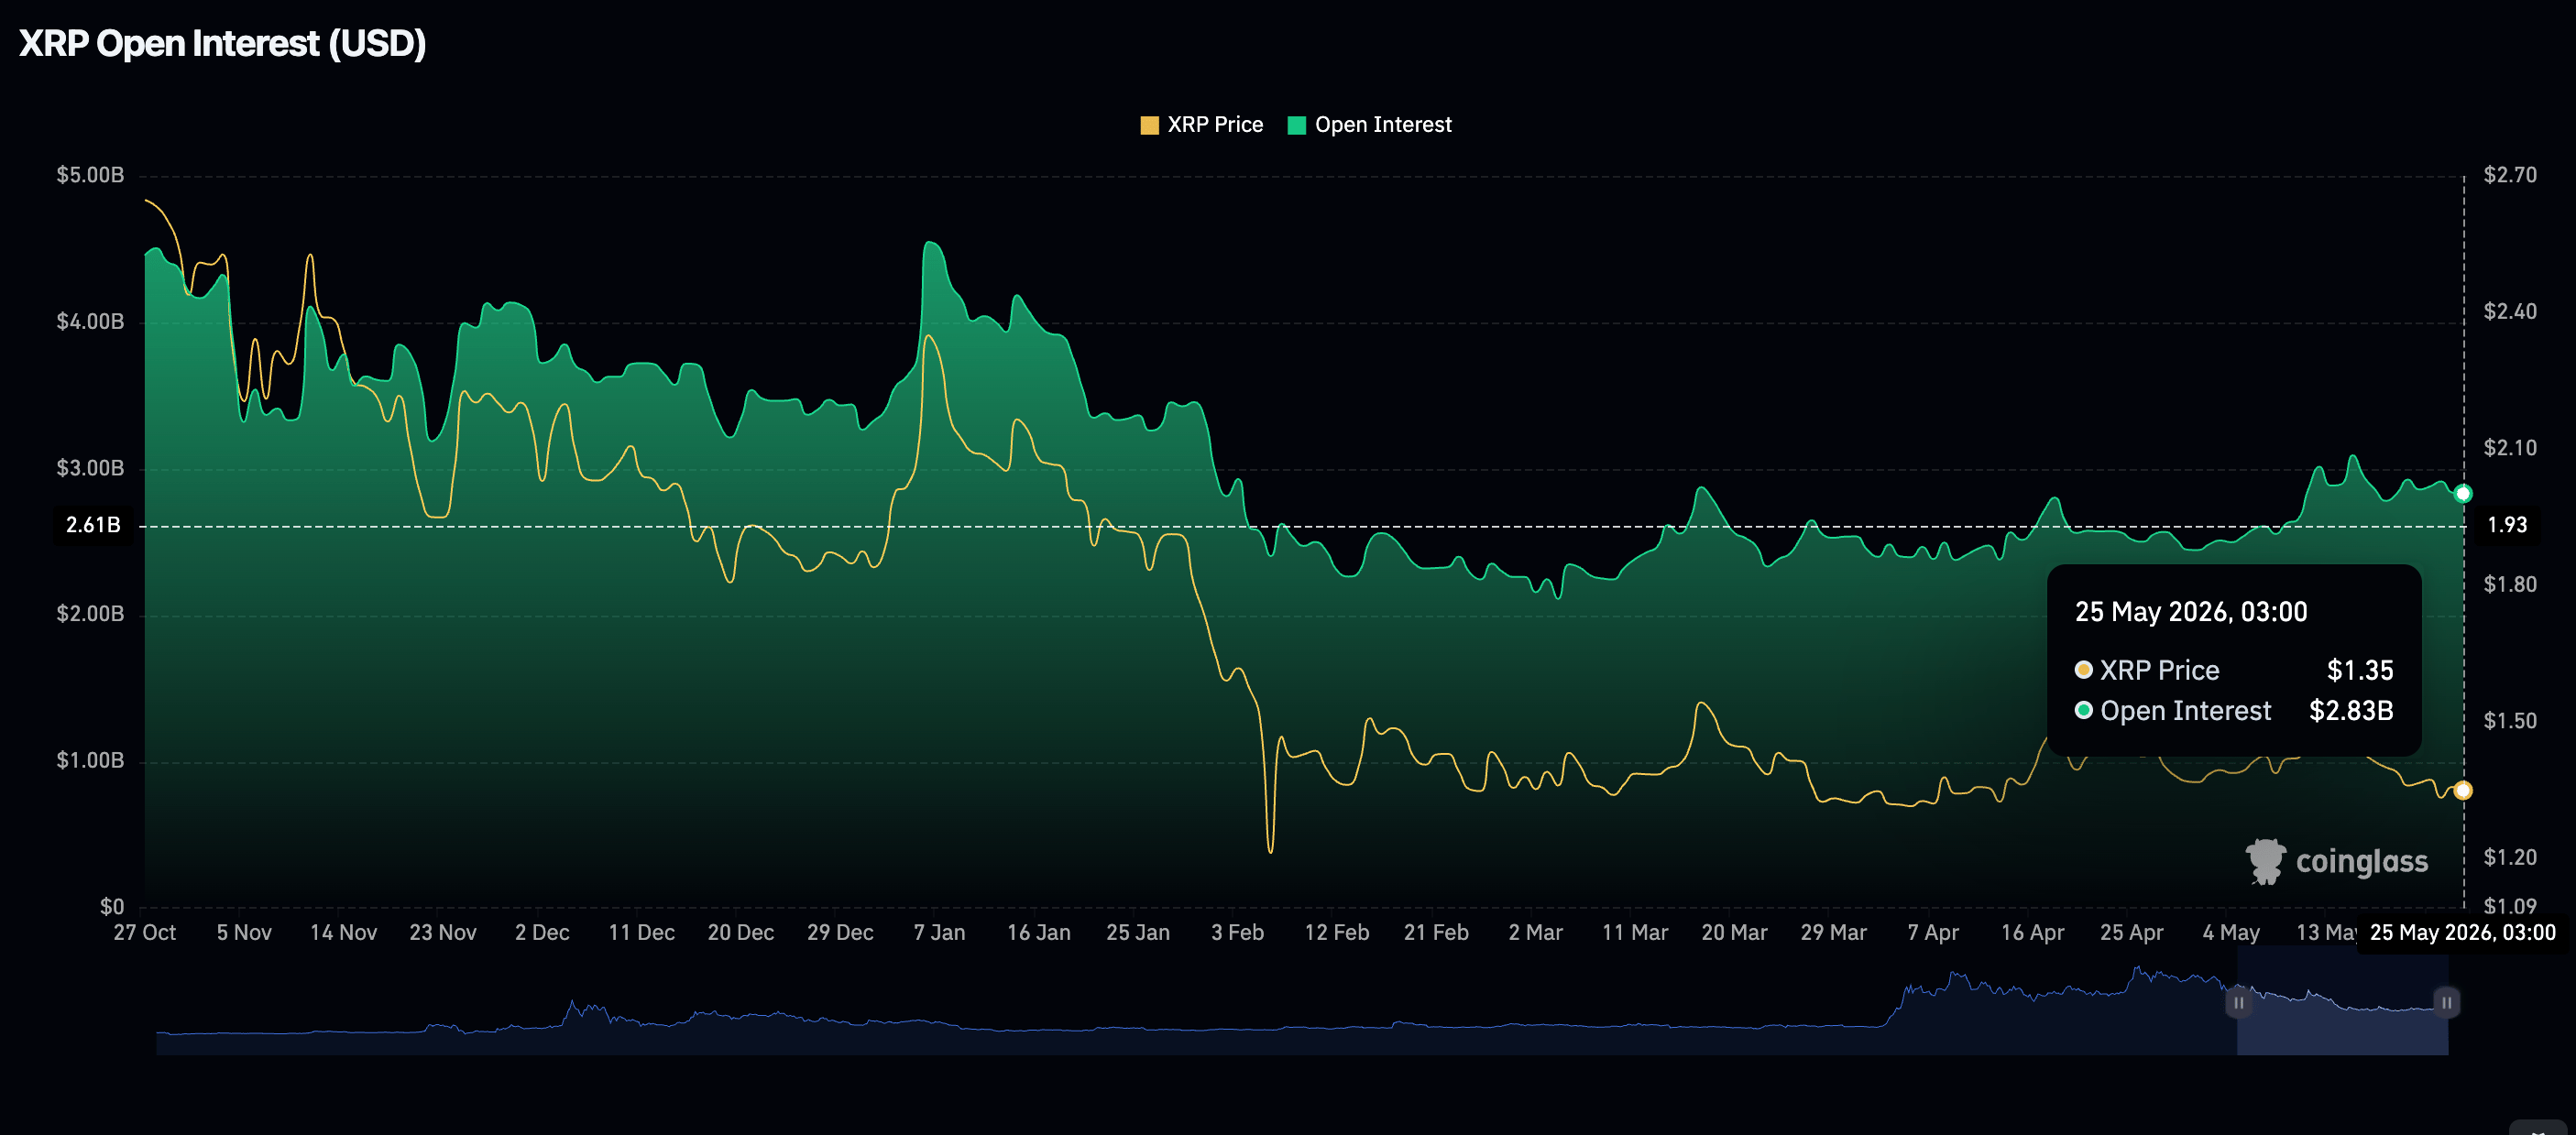
Still, market participants should take into account the softening retail demand, as reflected by futures Open Interest (OI) easing to $2.83 billion on Monday, from $2.91 billion the previous day. If the decline in the derivatives market persists, it would signal a lack of conviction in XRP’s ability to sustain an uptrend and could prompt traders to close rather than open new positions.
Price analysis: XRP defends key support
XRP trades at $1.36 and remains capped in a bearish near-term bias as its spot price holds below the 50-day Exponential Moving Average (EMA) at roughly $1.40. The Bollinger Bands middle line near $1.41, the 100-day and 200-day EMAs at $1.47 and around $1.68, respectively, sit higher as broader trend barriers.
Momentum indicators support this cautious outlook, with the Relative Strength Index (RSI) remaining subdued below the 50 level, hovering near 45 on the daily chart despite rising from last week’s low at 38, while the Moving Average Convergence Divergence (MACD) histogram holds in negative territory. This combination suggests that any price rallies are likely to encounter persistent selling pressure.
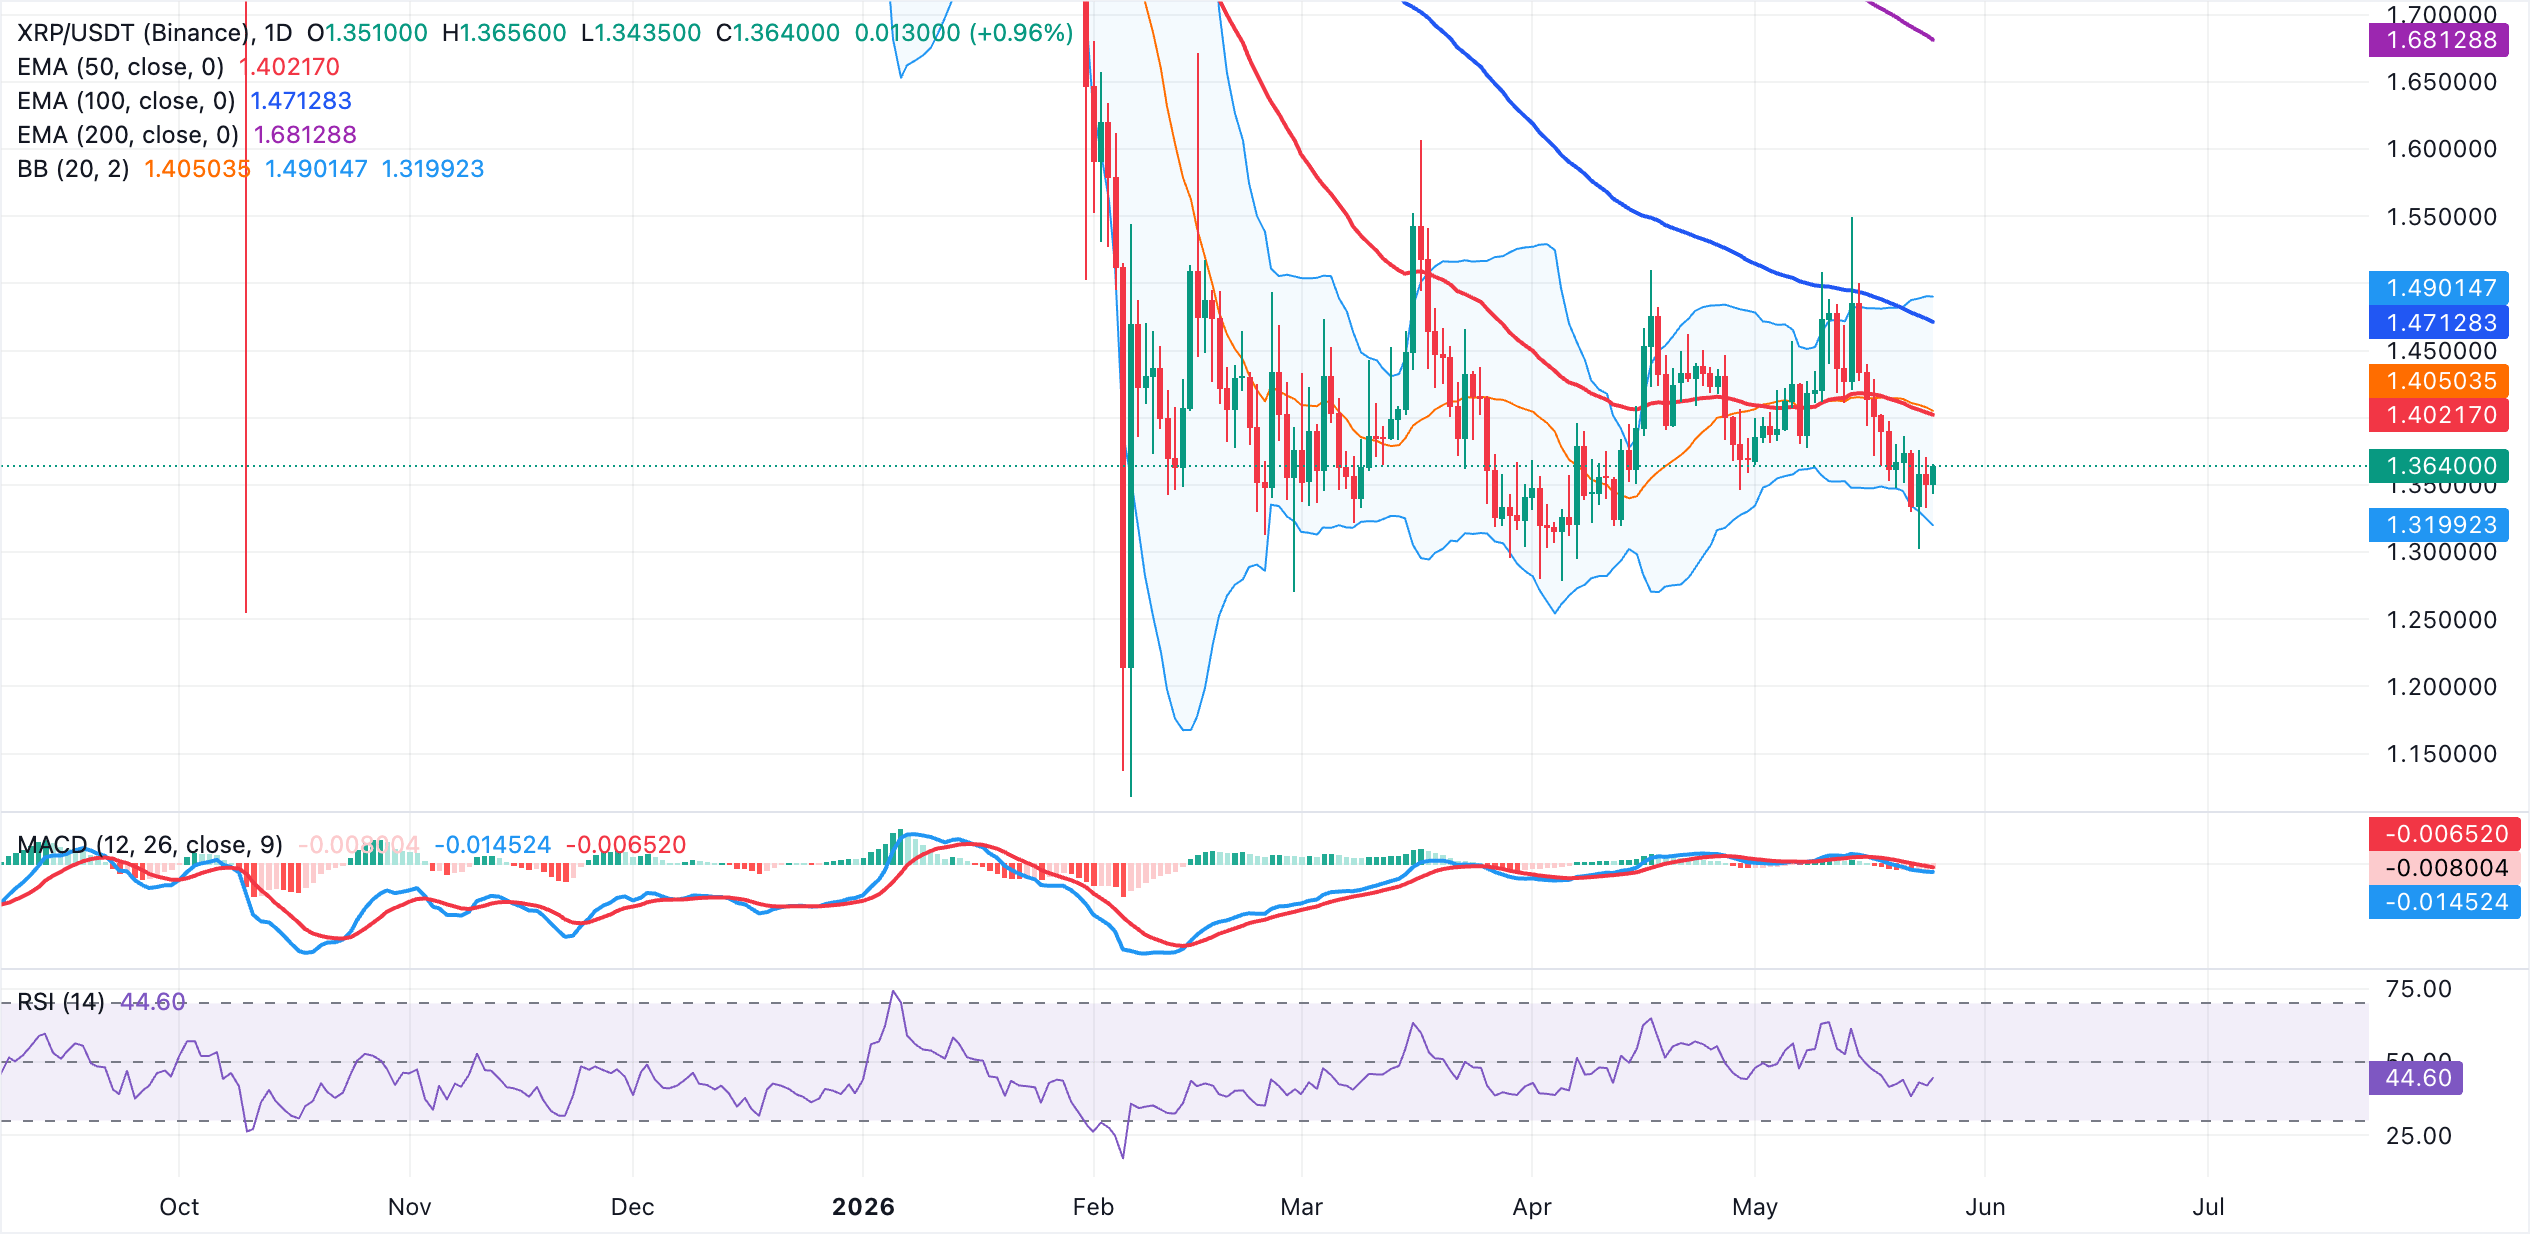
On the topside, initial resistance is clustered around the 50-day EMA at $1.40 and the Bollinger Bands midline near $1.41, followed by the 100-day EMA at $1.47 and then the upper Bollinger band around $1.49 before the longer-term 200-day EMA near $1.68 comes into play. On the downside, the first notable support emerges at the short-term $1.35 demand area, followed by the lower Bollinger band around $1.32, where a break would open the door to a deeper correction as bears attempt to extend the current bias.
(The technical analysis of this story was written with the help of an AI tool.)
Cryptocurrency metrics FAQs
The developer or creator of each cryptocurrency decides on the total number of tokens that can be minted or issued. Only a certain number of these assets can be minted by mining, staking or other mechanisms. This is defined by the algorithm of the underlying blockchain technology. On the other hand, circulating supply can also be decreased via actions such as burning tokens, or mistakenly sending assets to addresses of other incompatible blockchains.
Market capitalization is the result of multiplying the circulating supply of a certain asset by the asset’s current market value.
Trading volume refers to the total number of tokens for a specific asset that has been transacted or exchanged between buyers and sellers within set trading hours, for example, 24 hours. It is used to gauge market sentiment, this metric combines all volumes on centralized exchanges and decentralized exchanges. Increasing trading volume often denotes the demand for a certain asset as more people are buying and selling the cryptocurrency.
Funding rates are a concept designed to encourage traders to take positions and ensure perpetual contract prices match spot markets. It defines a mechanism by exchanges to ensure that future prices and index prices periodic payments regularly converge. When the funding rate is positive, the price of the perpetual contract is higher than the mark price. This means traders who are bullish and have opened long positions pay traders who are in short positions. On the other hand, a negative funding rate means perpetual prices are below the mark price, and hence traders with short positions pay traders who have opened long positions.
Recommended Articles


