

Pi Network Price Forecast: PI hits record low as bearish pressure overwhelms rebound hopes

Source Fxstreet
  • Pi Network hits a record low, down over 5% so far on Monday, extending the previous day’s 6% decline.
  • PI Open Interest drops to $6.57 million, from $8.54 million last week, suggesting a positional wipeout.
  • The technical outlook for the PI token is bearish, with selling pressure remaining firm despite oversold conditions.

Pi Network (PI) is trading at a record low, with over 5% losses so far on Monday, following the previous day’s 6% decline. The PI token's retail appeal also takes a hit, with its Open Interest down by over 20% in a week, indicating a large-scale unwinding of active positions. The technical outlook for PI is bearish as the downside momentum persists despite oversold conditions. 

PI retail support declines

Pi Network is losing retail support as broader crypto market sentiment falters amid uncertainty following the US midterm results. Blockworks data shows that the PI Open Interest (OI) has dropped to $6.57 million on Monday, from $8.54 million last week, indicating a 23% decline in the notional value of active positions. Typically, the decline in OI and spot price indicates a firm sell-side bias with a risk-off sentiment amid forced liquidation. 
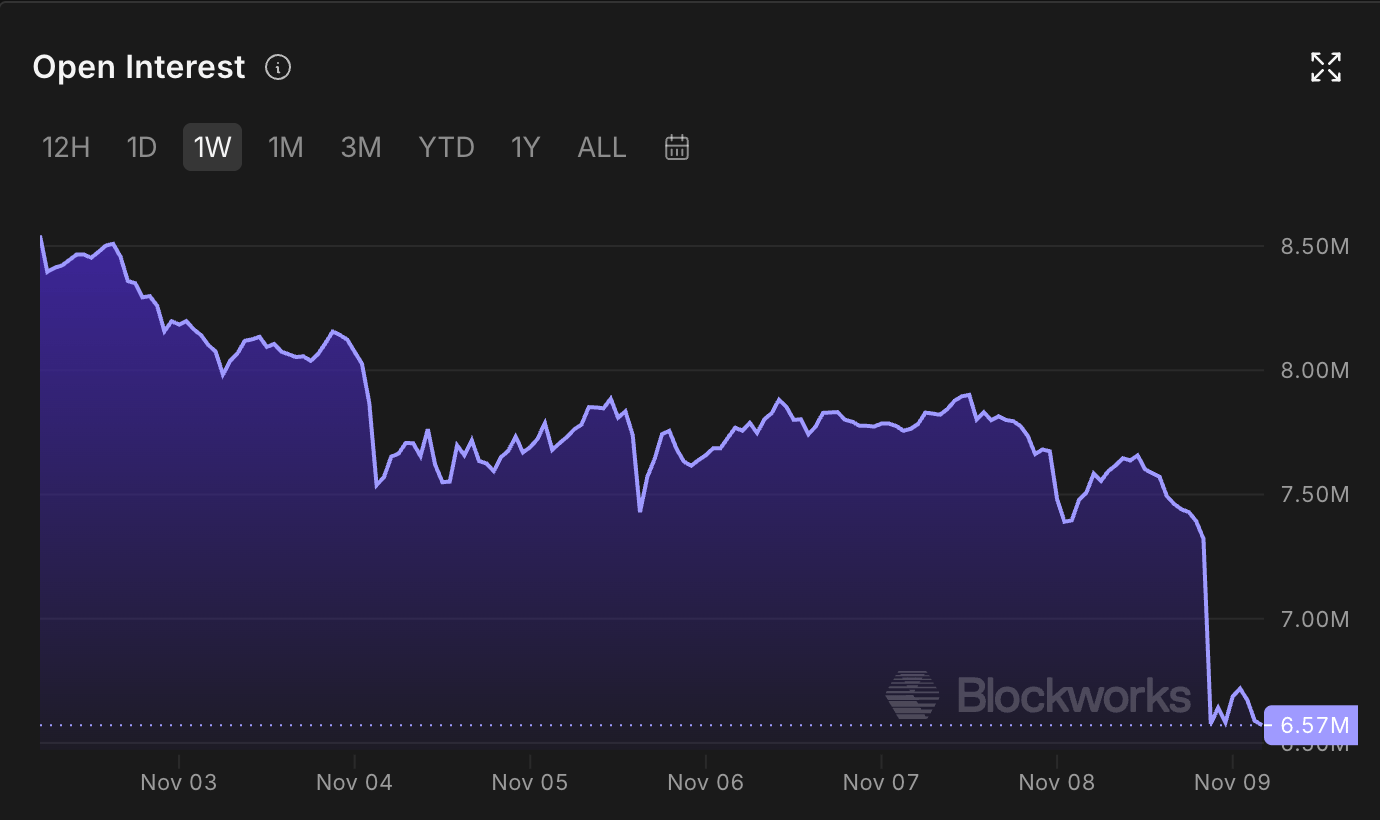
PI token Open Interest chart. Source: Blockworks

Technical outlook: How low will PI go?

Pi Network trades at $0.0656 at press time on Monday, extending its bearish tone to a record low. The price remains capped below an overhead resistance trendline at $0.0757 and breaks below the previous swing low of $0.0704 set on July 14.

PI sits well below the 50-day Exponential Moving Average (EMA) at $0.0803 and the 200-day EMA at $0.1101, keeping the broader trend decisively under pressure. Momentum shows oversold conditions, with the Relative Strength Index (RSI) reading near 18, suggesting a stretched downside. Meanwhile, the Moving Average Convergence Divergence (MACD) line crosses below its signal line in the negative territory, reinforcing weak momentum.

Looking down, the Fibonacci retracement of the previous downswing from $0.1394 to $0.0704 highlights the next support at the 127.2% extension level at $0.0516, followed by the 161.8% extension level at $0.0277.

Chart Analysis PI/USD (baha Crypto)
PI/USD daily price chart.

On the topside, initial resistance is now evident at the broken horizontal support at $0.0704, followed by the trendline break level around $0.0757, which previously acted as a pivotal barrier.

(The technical analysis of this story was written with the help of an AI tool. Know more.)

Disclaimer: For information purposes only. Past performance is not indicative of future results.
placeholder
TradingKey Daily Market Brief: Nasdaq Falls Over 5%, AI Stocks Plunge as Nvidia Drops Over 9%, Micron Falls Over 17%, SanDisk Drops Over 22% During the Asian trading session on November 6, the three major U.S. stock indices tumbled across the board overnight as the sell-off across the AI data center suppl
Author  TradingKey
Nov 06, Fri
During the Asian trading session on November 6, the three major U.S. stock indices tumbled across the board overnight as the sell-off across the AI data center suppl
placeholder
Gold Price Analysis Today | Forex Gold Analysis | XAU/USD Analysis - November 6, 2026Get the latest gold price analysis, forex gold insights, and XAU/USD analysis for November 6, 2026. Read on for the details.
Author  Mitrade
Nov 06, Fri
Get the latest gold price analysis, forex gold insights, and XAU/USD analysis for November 6, 2026. Read on for the details.
placeholder
Micron's $4.5 billion Taiwan fab won't make a chip until 2028 — the market sold it as a 2026 problemMicron fell 17.46% to $656.39 after Bloomberg reported construction at its $4.5 billion Taoyuan Fab 11E had all but halted over a labor dispute. The plant was not due online until 2028, so no 2026 output is lost. With FY27 EPS consensus near $160 and 2027 HBM sold out, the selloff is a peak-cycle multiple reset, not a demand collapse — and $650 is the line that separates the two.
Author  Irene Q.
Nov 06, Fri
Micron fell 17.46% to $656.39 after Bloomberg reported construction at its $4.5 billion Taoyuan Fab 11E had all but halted over a labor dispute. The plant was not due online until 2028, so no 2026 output is lost. With FY27 EPS consensus near $160 and 2027 HBM sold out, the selloff is a peak-cycle multiple reset, not a demand collapse — and $650 is the line that separates the two.
placeholder
Gold Price Analysis Today | Forex Gold Analysis | XAU/USD Analysis - November 9, 2026Get the latest gold price analysis, forex gold insights, and XAU/USD analysis for November 9, 2026. Read on for the details.
Author  Mitrade
5 hours ago
Get the latest gold price analysis, forex gold insights, and XAU/USD analysis for November 9, 2026. Read on for the details.
placeholder
Bitcoin ETFs sold $1.28 billion in a week — and BTC is still above 75,000US spot Bitcoin ETFs logged $1.28 billion of net outflows in the week to Nov 6, the largest since late June, with BlackRock's IBIT accounting for $1.21 billion. Yet BTC only fell from $80,405 to $74,940, a 6.8% move. The gap between the fund flow and the price is the story: leveraged longs were flushed, but spot holders did not follow the ETFs out — and $75,000 is the line that decides whether that reading holds.
Author  Suzie
5 hours ago
US spot Bitcoin ETFs logged $1.28 billion of net outflows in the week to Nov 6, the largest since late June, with BlackRock's IBIT accounting for $1.21 billion. Yet BTC only fell from $80,405 to $74,940, a 6.8% move. The gap between the fund flow and the price is the story: leveraged longs were flushed, but spot holders did not follow the ETFs out — and $75,000 is the line that decides whether that reading holds.
goTop
quote