

Quant Price Forecast: QNT rallies 350% in a week on major tokenization deal

Source Fxstreet
  • Quant is down nearly 10% on Monday, showing signs of mild easing after rallying nearly 350% last week.
  • Quant partnered with The Clearing House on Thursday, emerging as a settlement layer for tokenized deposits across 25 major US banks.
  • The technical outlook for QNT is bullish, with the price trading around a 4-year high amid strong bullish momentum.

Quant (QNT) price hovers above $250 on Monday following a parabolic rise of nearly 350% last week. The Clearing House deal positions Quant as a settlement layer across 25 major banks for tokenized deposits amid the US government's strong push for tokenized stocks and other Real-World Assets (RWAs). Retail speculation builds toward QNT, with its futures Open Interest rising to a record high of $158.80 million, indicating firm leverage-exposed participation.

Bullish speculation grows firm on tokenized deposits deal

Quant rallied nearly 350% last week, gaining strong retail demand on the announcement of a partnership with The Clearing House. The deal enables Quant to serve as the transaction layer for clearing and settling tokenized deposits across 25 major US banks, as previously reported by FXStreet. 

On the retail side, the QNT futures Open Interest (OI) surged to $158.80 million, suggesting a sharp increase in leverage-driven positional buildup. At the same time, the funding rate fluctuates, flipping to -0.0136%, suggesting a mild bearish incline among traders as the rally stretches thin.
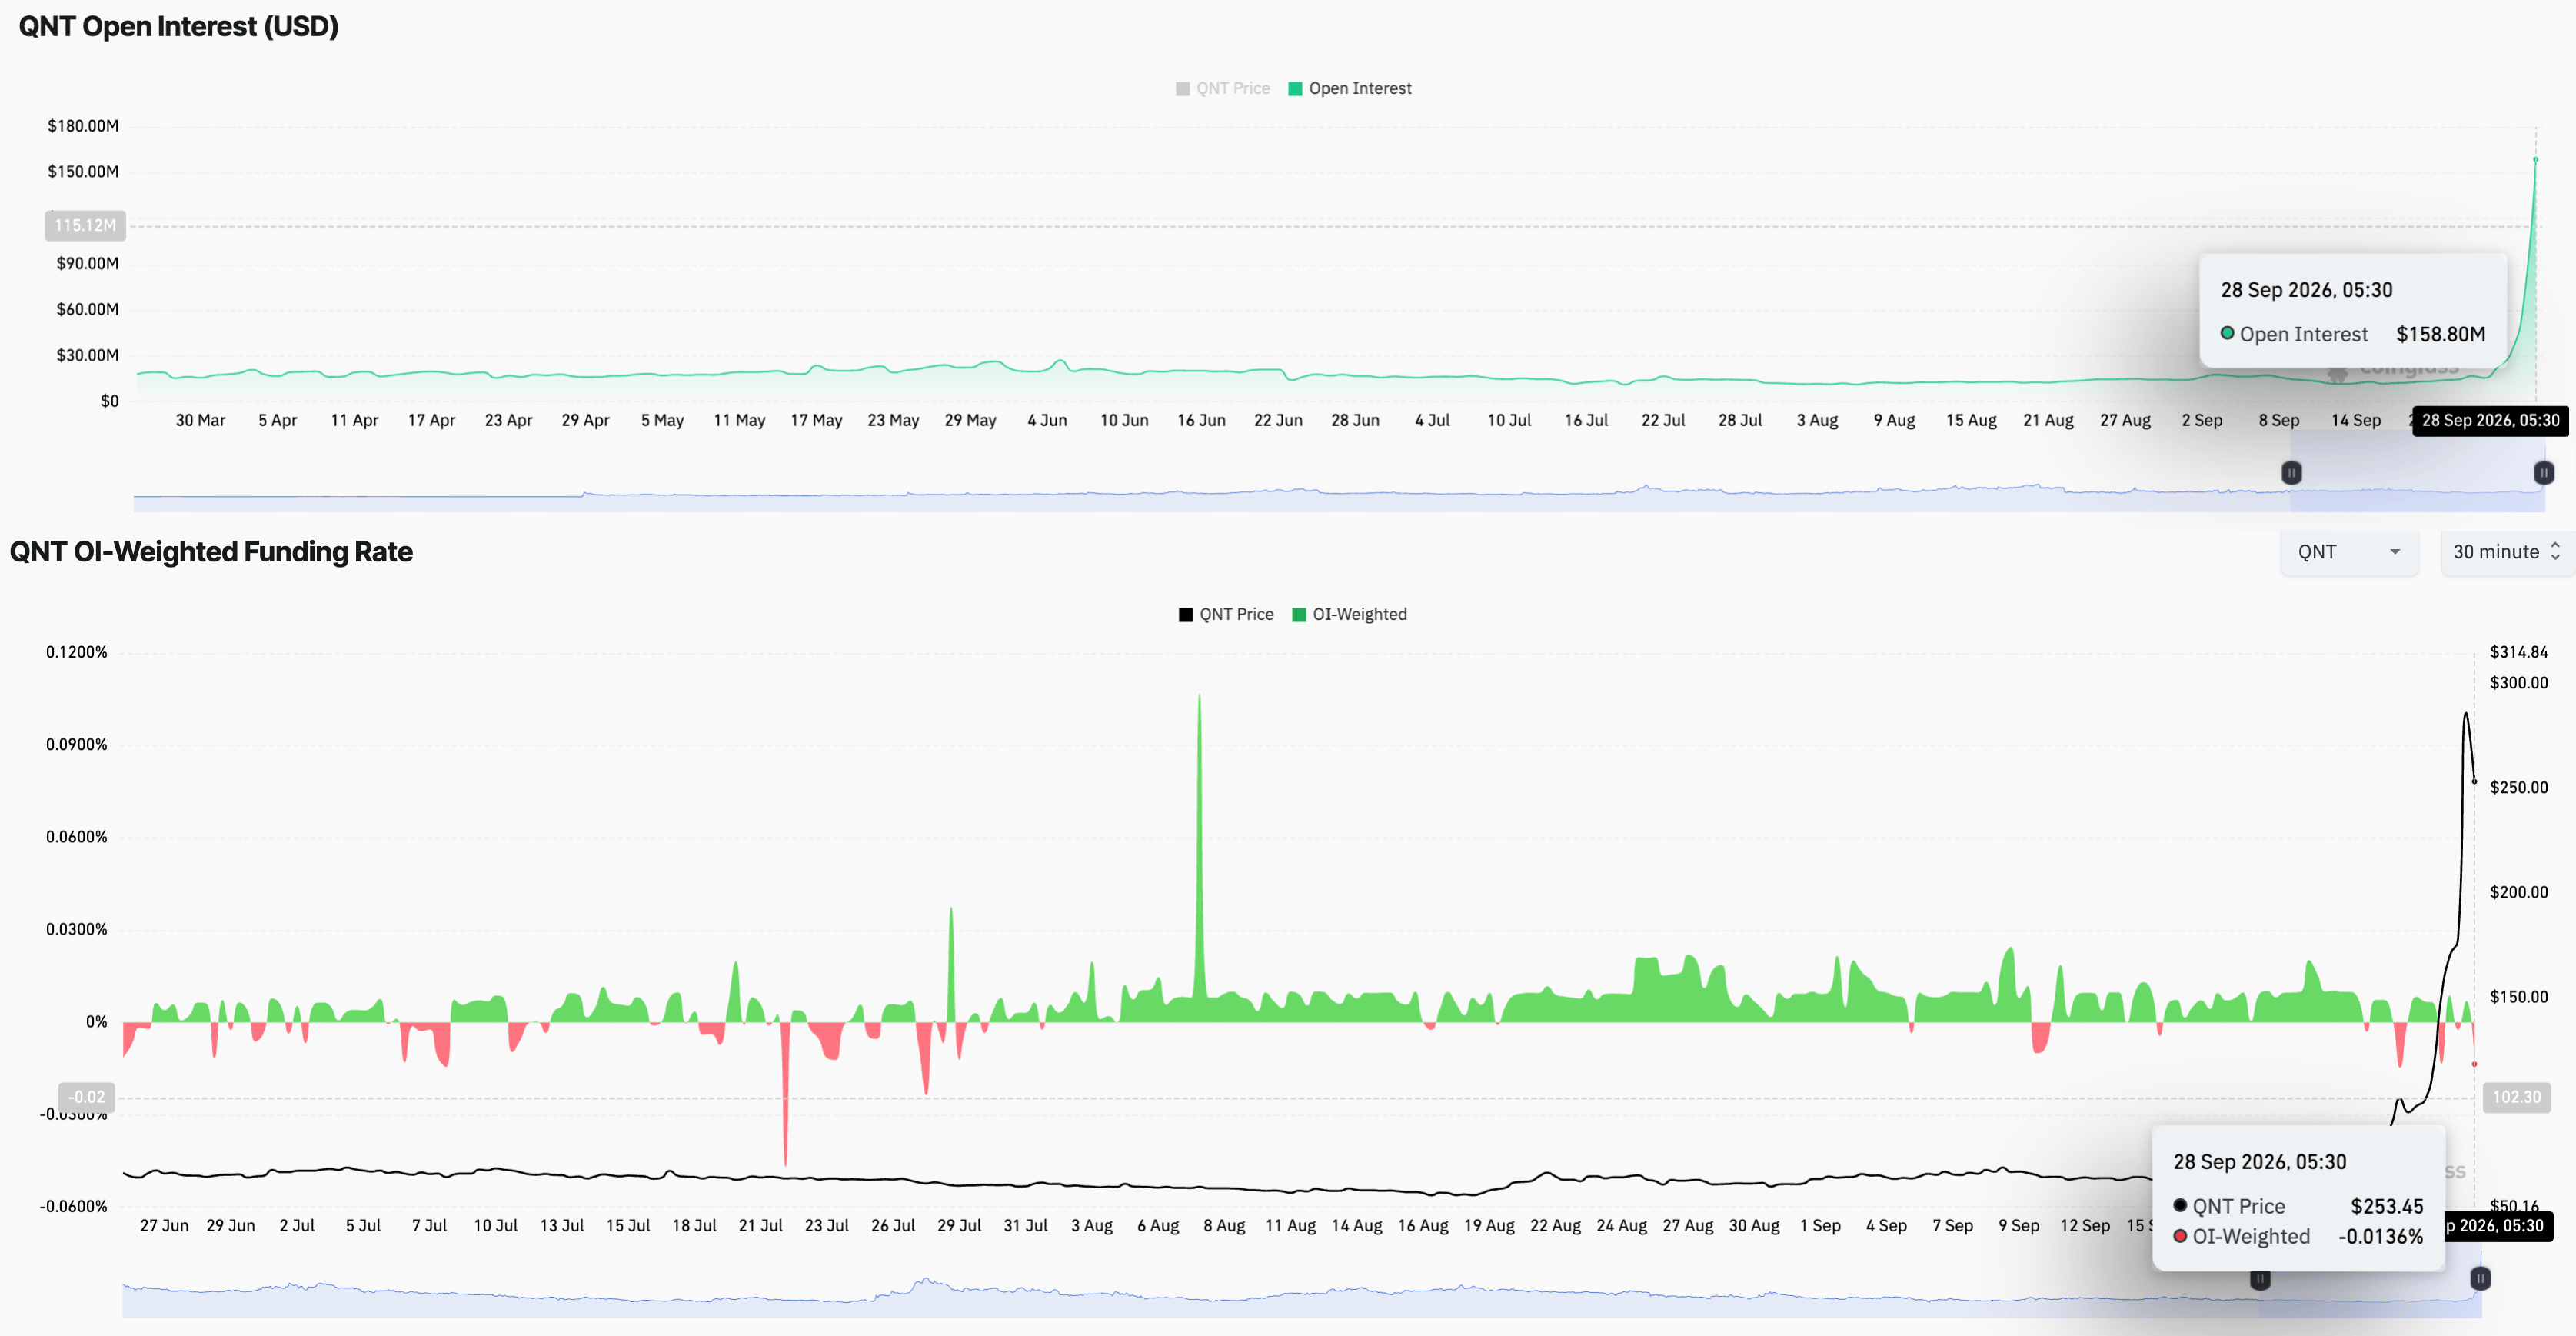
QNT derivatives data. Source: CoinGlass

Technical outlook: QNT rally steadies above $250 as bulls eye a fresh record high

Quant trades around $254 at press time on Monday, holding steady after a parabolic rise last week. QNT sits well above the major 50-, 100-, and 200-week Exponential Moving Averages (EMAs) at $87.78, $88.89 and $102.44, respectively, providing a broad underlying support zone.

The 50-week EMA crosses above the 200-week EMA, which is commonly referred to as a Golden Cross pattern, suggesting a long-term bullish trend reversal. Momentum on the week chart hits record high levels, with the Relative Strength Index (RSI) at 80, deep into the overbought territory. At the same time, the Moving Average Convergence Divergence (MACD) and signal line extend an uptrend to 26.22 and 20.85, with expanding bullish histograms, suggesting a firm control of buyers on the trend.

The Fibonacci retracement over last week's price range from $64.16 to $373.00 highlights the immediate support level at the 78.6% Fibonacci retracement level at $255, followed by the October 17, 2022 and December 2, 2024 highs around $228 and $171.70, respectively.

Looking up, QNT must surpass last week's high at $373 to test its record high of $430 set by the September 6, 2021 high. A confirmed breakout above this level could target the 127.2% Fibonacci extension level at $602.05.

Chart Analysis QNT/USDT (Binance)
QNT/USDT daily price chart.

(The technical analysis of this story was written with the help of an AI tool. Know more.)

Disclaimer: For information purposes only. Past performance is not indicative of future results.
placeholder
October hike odds climb toward 60% as Goldman and BofA both flip — what Warsh's "dose of accommodation" really changedRate futures now price roughly 55% to 62% for a 25bp hike at the October 27-28 FOMC, up from about 30% before Chair Warsh's post-meeting framing that the Fed is merely "removing some accommodation." Goldman Sachs has added an October hike to its forecast and Bank of America now sees moves in both October and December. Here is the repricing, the language behind it, and the two data points that decide it.
Author  Irene Q.
Sep 23, Wed
Rate futures now price roughly 55% to 62% for a 25bp hike at the October 27-28 FOMC, up from about 30% before Chair Warsh's post-meeting framing that the Fed is merely "removing some accommodation." Goldman Sachs has added an October hike to its forecast and Bank of America now sees moves in both October and December. Here is the repricing, the language behind it, and the two data points that decide it.
placeholder
【Daily Brief】30-year Treasury tops 5.59%, S&P 500 slips to 7,670 and gold holds $4,180 — PCE lands tonightThe 30-year Treasury yield closed at 5.59%, its highest since June 2002, and the Dow fell 131.59 points to 51,349.92. US consumer confidence dropped to 81.9, a 12-year low, and JOLTS job openings fell to 7.1 million. August PCE and Q3 GDP both land at 8:30am ET tonight.
Author  Suzie
Sep 30, Wed
The 30-year Treasury yield closed at 5.59%, its highest since June 2002, and the Dow fell 131.59 points to 51,349.92. US consumer confidence dropped to 81.9, a 12-year low, and JOLTS job openings fell to 7.1 million. August PCE and Q3 GDP both land at 8:30am ET tonight.
placeholder
Gold falls to near $4,150 as higher Treasury yields, oil prices outweigh softer PCE inflationGold price (XAU/USD) tumbles to near $4,150 during the early Asian session on Thursday, pressured by elevated US Treasury bond yields. Traders await the US September employment data for fresh impetus, which will be released later on Friday. 
Author  FXStreet
Oct 01, Thu
Gold price (XAU/USD) tumbles to near $4,150 during the early Asian session on Thursday, pressured by elevated US Treasury bond yields. Traders await the US September employment data for fresh impetus, which will be released later on Friday. 
placeholder
United States Dollar Index sits near March 2025 highs, above 102.00 ahead of US NFPThe US Dollar Index (DXY), which tracks the Greenback against a basket of currencies, attracts buyers for the fifth straight day and climbs back above the 102.00 mark during the Asian session on Friday.
Author  FXStreet
23 hours ago
The US Dollar Index (DXY), which tracks the Greenback against a basket of currencies, attracts buyers for the fifth straight day and climbs back above the 102.00 mark during the Asian session on Friday.
placeholder
WTI Price Forecast: Dips to $91.50 as Middle East jitters limit lossesWest Texas Intermediate (WTI) – the benchmark US Crude Oil price – attracts some sellers during the Asian session on Friday, snapping a two-day winning streak and stalling the previous day's recovery from the vicinity of a nearly four-week low.
Author  FXStreet
19 hours ago
West Texas Intermediate (WTI) – the benchmark US Crude Oil price – attracts some sellers during the Asian session on Friday, snapping a two-day winning streak and stalling the previous day's recovery from the vicinity of a nearly four-week low.
goTop
quote