

Solana (SOLUSD) Is up 1.08% on Oct 3: Why It Happened

Source Tradingkey

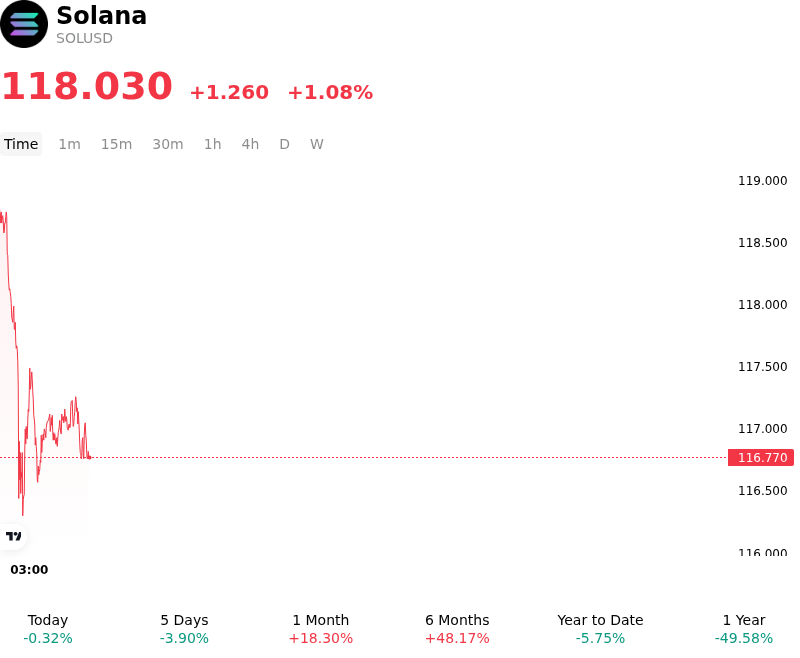
Solana (SOLUSD) is up 1.08% at Oct 3 21:00(ET), now at $118.03, with a 7-day down of 1.10%.
SummaryOverview

What is driving Solana (SOLUSD)’s stock price up today?

Capital flowed into Solana as persistent institutional demand via spot Solana exchange-traded funds provided structural buying support across digital asset trading sessions. Sustained net inflows into spot Solana ETFs demonstrate that institutional allocators are increasingly treating the token as a core high-throughput smart contract asset alongside Bitcoin and Ethereum. This structural bid has tightened spot market liquidity on major exchanges, absorbing overhead sell pressure and encouraging systematic capital allocations into the market.

Reinforcing institutional confidence, Solana's fundamental ecosystem metrics continue to reflect robust network utilization and capital retention. Dominant performance across decentralized exchange throughput, real-world asset tokenization, and stablecoin settlement volume has sustained the network's leading share of on-chain application revenue. High staking participation rates continue to reduce circulating exchange supply, dampening potential downside volatility. Furthermore, ongoing technical milestones and validator infrastructure developments, including long-term performance optimizations like Firedancer, maintain strong expectations for sustained throughput scalability.

From a global macro perspective, favorable liquidity conditions and steady risk appetite across broader risk assets have facilitated cross-market capital rotation into high-beta layer-one protocols. Expanding open interest in perpetual futures and derivatives venues points to constructive market positioning rather than speculative leverage exhaustion. While investors continue to monitor broader regulatory developments and scheduled supply unlocks, the underlying move reflects a solid alignment of spot ETF demand, deep ecosystem execution, and constructive risk-on sentiment.

Technical Analysis of Solana (SOLUSD)

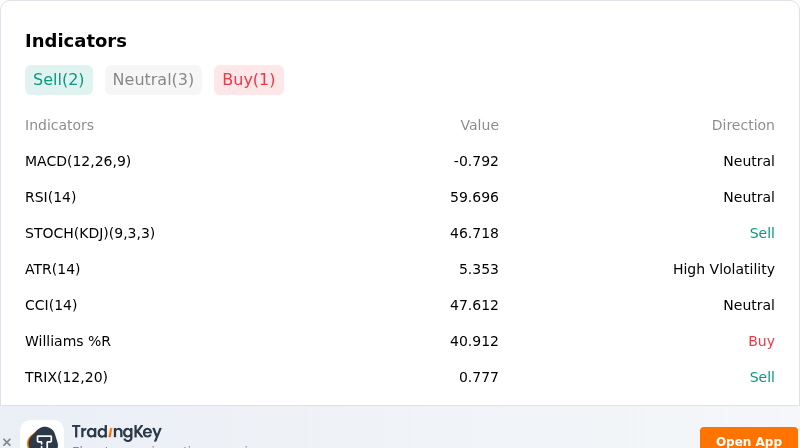
Technically, Solana (SOLUSD) shows a MACD (12,26,9) value of -0.792, indicating a neutral signal. The RSI at 59.696 suggests neutral condition and the Williams %R at 40.912 suggests buy condition. Please monitor closely.
IndicatorAnalysis

More details about Solana (SOLUSD)

Recent Events and Risks:

  • Whale Unstaking and Centralized Exchange Inflows: On-chain tracking highlights substantial whale activity, including major wallet unstaking and multi-million dollar transfers directly to centralized exchanges like Binance, creating immediate sell-side supply pressure and overhead resistance.
  • Derivatives Over-Leverage and Liquidation Cascades: Futures open interest remains heavily skewed toward long positions near key technical support levels, leaving Solana highly vulnerable to forced liquidation cascades and sharp intraday drawdowns if price pivots break down.
  • Mainnet Upgrade Timeline Uncertainty: Speculative momentum experienced a cooldown after core developers confirmed that the performance-enhancing Alpenglow consensus upgrade remains confined to the testnet phase without a confirmed mainnet deployment date, prompting sell-the-fact profit-taking.
  • Macro Risk-Off Sentiment and High-Beta Exposure: Persistent upward pressure on U.S. Treasury yields and U.S. dollar strength continue to tighten global liquidity, exposing high-beta altcoins like Solana to outsized macro-driven selling and contracting decentralized exchange (DEX) trading volumes.
Disclaimer: For information purposes only. Past performance is not indicative of future results.
placeholder
October hike odds climb toward 60% as Goldman and BofA both flip — what Warsh's "dose of accommodation" really changedRate futures now price roughly 55% to 62% for a 25bp hike at the October 27-28 FOMC, up from about 30% before Chair Warsh's post-meeting framing that the Fed is merely "removing some accommodation." Goldman Sachs has added an October hike to its forecast and Bank of America now sees moves in both October and December. Here is the repricing, the language behind it, and the two data points that decide it.
Author  Irene Q.
Sep 23, Wed
Rate futures now price roughly 55% to 62% for a 25bp hike at the October 27-28 FOMC, up from about 30% before Chair Warsh's post-meeting framing that the Fed is merely "removing some accommodation." Goldman Sachs has added an October hike to its forecast and Bank of America now sees moves in both October and December. Here is the repricing, the language behind it, and the two data points that decide it.
placeholder
【Daily Brief】30-year Treasury tops 5.59%, S&P 500 slips to 7,670 and gold holds $4,180 — PCE lands tonightThe 30-year Treasury yield closed at 5.59%, its highest since June 2002, and the Dow fell 131.59 points to 51,349.92. US consumer confidence dropped to 81.9, a 12-year low, and JOLTS job openings fell to 7.1 million. August PCE and Q3 GDP both land at 8:30am ET tonight.
Author  Suzie
Sep 30, Wed
The 30-year Treasury yield closed at 5.59%, its highest since June 2002, and the Dow fell 131.59 points to 51,349.92. US consumer confidence dropped to 81.9, a 12-year low, and JOLTS job openings fell to 7.1 million. August PCE and Q3 GDP both land at 8:30am ET tonight.
placeholder
Gold falls to near $4,150 as higher Treasury yields, oil prices outweigh softer PCE inflationGold price (XAU/USD) tumbles to near $4,150 during the early Asian session on Thursday, pressured by elevated US Treasury bond yields. Traders await the US September employment data for fresh impetus, which will be released later on Friday. 
Author  FXStreet
Oct 01, Thu
Gold price (XAU/USD) tumbles to near $4,150 during the early Asian session on Thursday, pressured by elevated US Treasury bond yields. Traders await the US September employment data for fresh impetus, which will be released later on Friday. 
placeholder
United States Dollar Index sits near March 2025 highs, above 102.00 ahead of US NFPThe US Dollar Index (DXY), which tracks the Greenback against a basket of currencies, attracts buyers for the fifth straight day and climbs back above the 102.00 mark during the Asian session on Friday.
Author  FXStreet
Yesterday 02: 51
The US Dollar Index (DXY), which tracks the Greenback against a basket of currencies, attracts buyers for the fifth straight day and climbs back above the 102.00 mark during the Asian session on Friday.
placeholder
WTI Price Forecast: Dips to $91.50 as Middle East jitters limit lossesWest Texas Intermediate (WTI) – the benchmark US Crude Oil price – attracts some sellers during the Asian session on Friday, snapping a two-day winning streak and stalling the previous day's recovery from the vicinity of a nearly four-week low.
Author  FXStreet
22 hours ago
West Texas Intermediate (WTI) – the benchmark US Crude Oil price – attracts some sellers during the Asian session on Friday, snapping a two-day winning streak and stalling the previous day's recovery from the vicinity of a nearly four-week low.
goTop
quote