

Meme Coins Price Prediction: Dogecoin, Shiba Inu, and Pepe – Bullish trend in works

Source Fxstreet
  • Dogecoin edges lower on Monday, hovering around $0.095 as buyers continue to struggle to surpass the $0.1000 mark.
  • Shiba Inu is experiencing a mild pullback, extending a consolidation between the 200-day EMA and a key Fibonacci resistance level.
  • Pepe holds steady after Friday's 2% loss, reflecting a lack of momentum to rally after a long-resistance trendline breakout.

Meme coins including Dogecoin (DOGE), Shiba Inu (SHIB), and Pepe (PEPE) make a soft start on Monday as key resistance levels capped gains last week. The technical outlook for DOGE, SHIB, and PEPE indicates a mixed bias, as prices remain above their 200-day Exponential Moving Average (EMA) while momentum wanes.


Dogecoin gains institutional interest

Dogecoin rallied 11% last week but remains capped below the $0.1000 psychological level amid renewed institutional interest in the meme coin. SoSoValue data shows DOGE-focused Exchange Traded Funds (ETFs) recorded $2.89 million in inflows last week, marking their largest weekly net inflow since inception. Typically, renewed ETF inflows suggest long-term upside in crypto assets, driven by institutional demand and a positive shift in retail and large-wallet investors' sentiment.
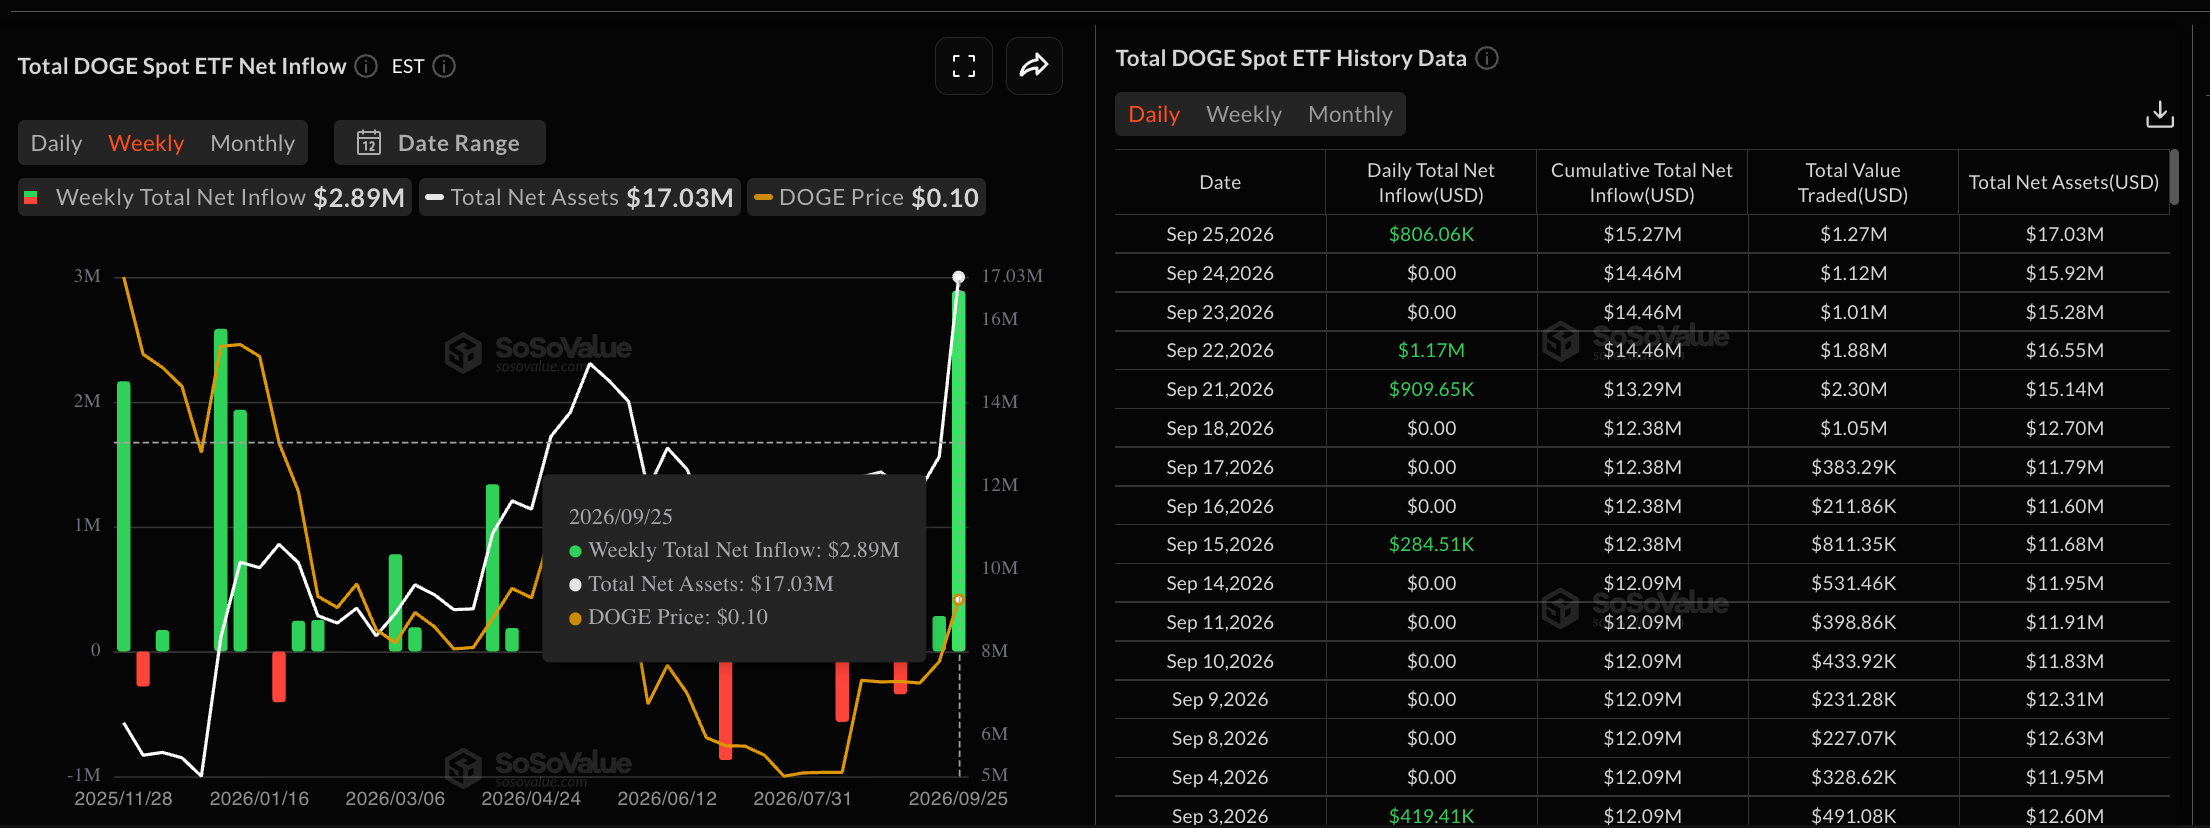
DOGE ETF data. Source: Sosovalue

Dogecoin trades around $0.0950 at press time on Monday, maintaining a bullish bias above the 50-, 100-, and 200-day Exponential Moving Averages (EMAs) around $0.0862, $0.0849, and $0.0933, respectively. These EMAs form a dense support layer for the meme coin.

Momentum indicators on the daily chart show mild weakness, as the Moving Average Convergence Divergence (MACD) stalls above its signal line with a contracting histogram. At the same time, the Relative Strength Index (RSI) near 57 declines toward the midline, reaffirming the fading of bullish momentum.

Looking up, Dogecoin must reclaim the $0.1000 psychological barrier to extend the upside toward the $0.1161 supply zone.

Chart Analysis DOGE/USDT (Binance)
DOGE/USDT daily price chart.

On the downside, initial support is at the 200-day EMA at $0.0933, with deeper support at the 50-day EMA at $0.0862 and the 100-day EMA at $0.0849.

Shiba Inu holds above key support amid rising downside pressure

Shiba Inu edges lower on Monday, trading below $0.00000600 despite an 8% rise the previous week. The meme coin retraces toward the 200-day EMA at $0.00000564 as the recent recovery remains capped at the 78.6% Fibonacci retracement level at $0.00000613, measured from $0.00000670 to $0.00000405.

Momentum weakens with the RSI sliding to 57 on the daily chart, indicating an easing in buying pressure.

For a sustained uptrend, SHIB must confirm a bullish breakout above $0.00000613 to open the door toward the $0.00000670 swing high.
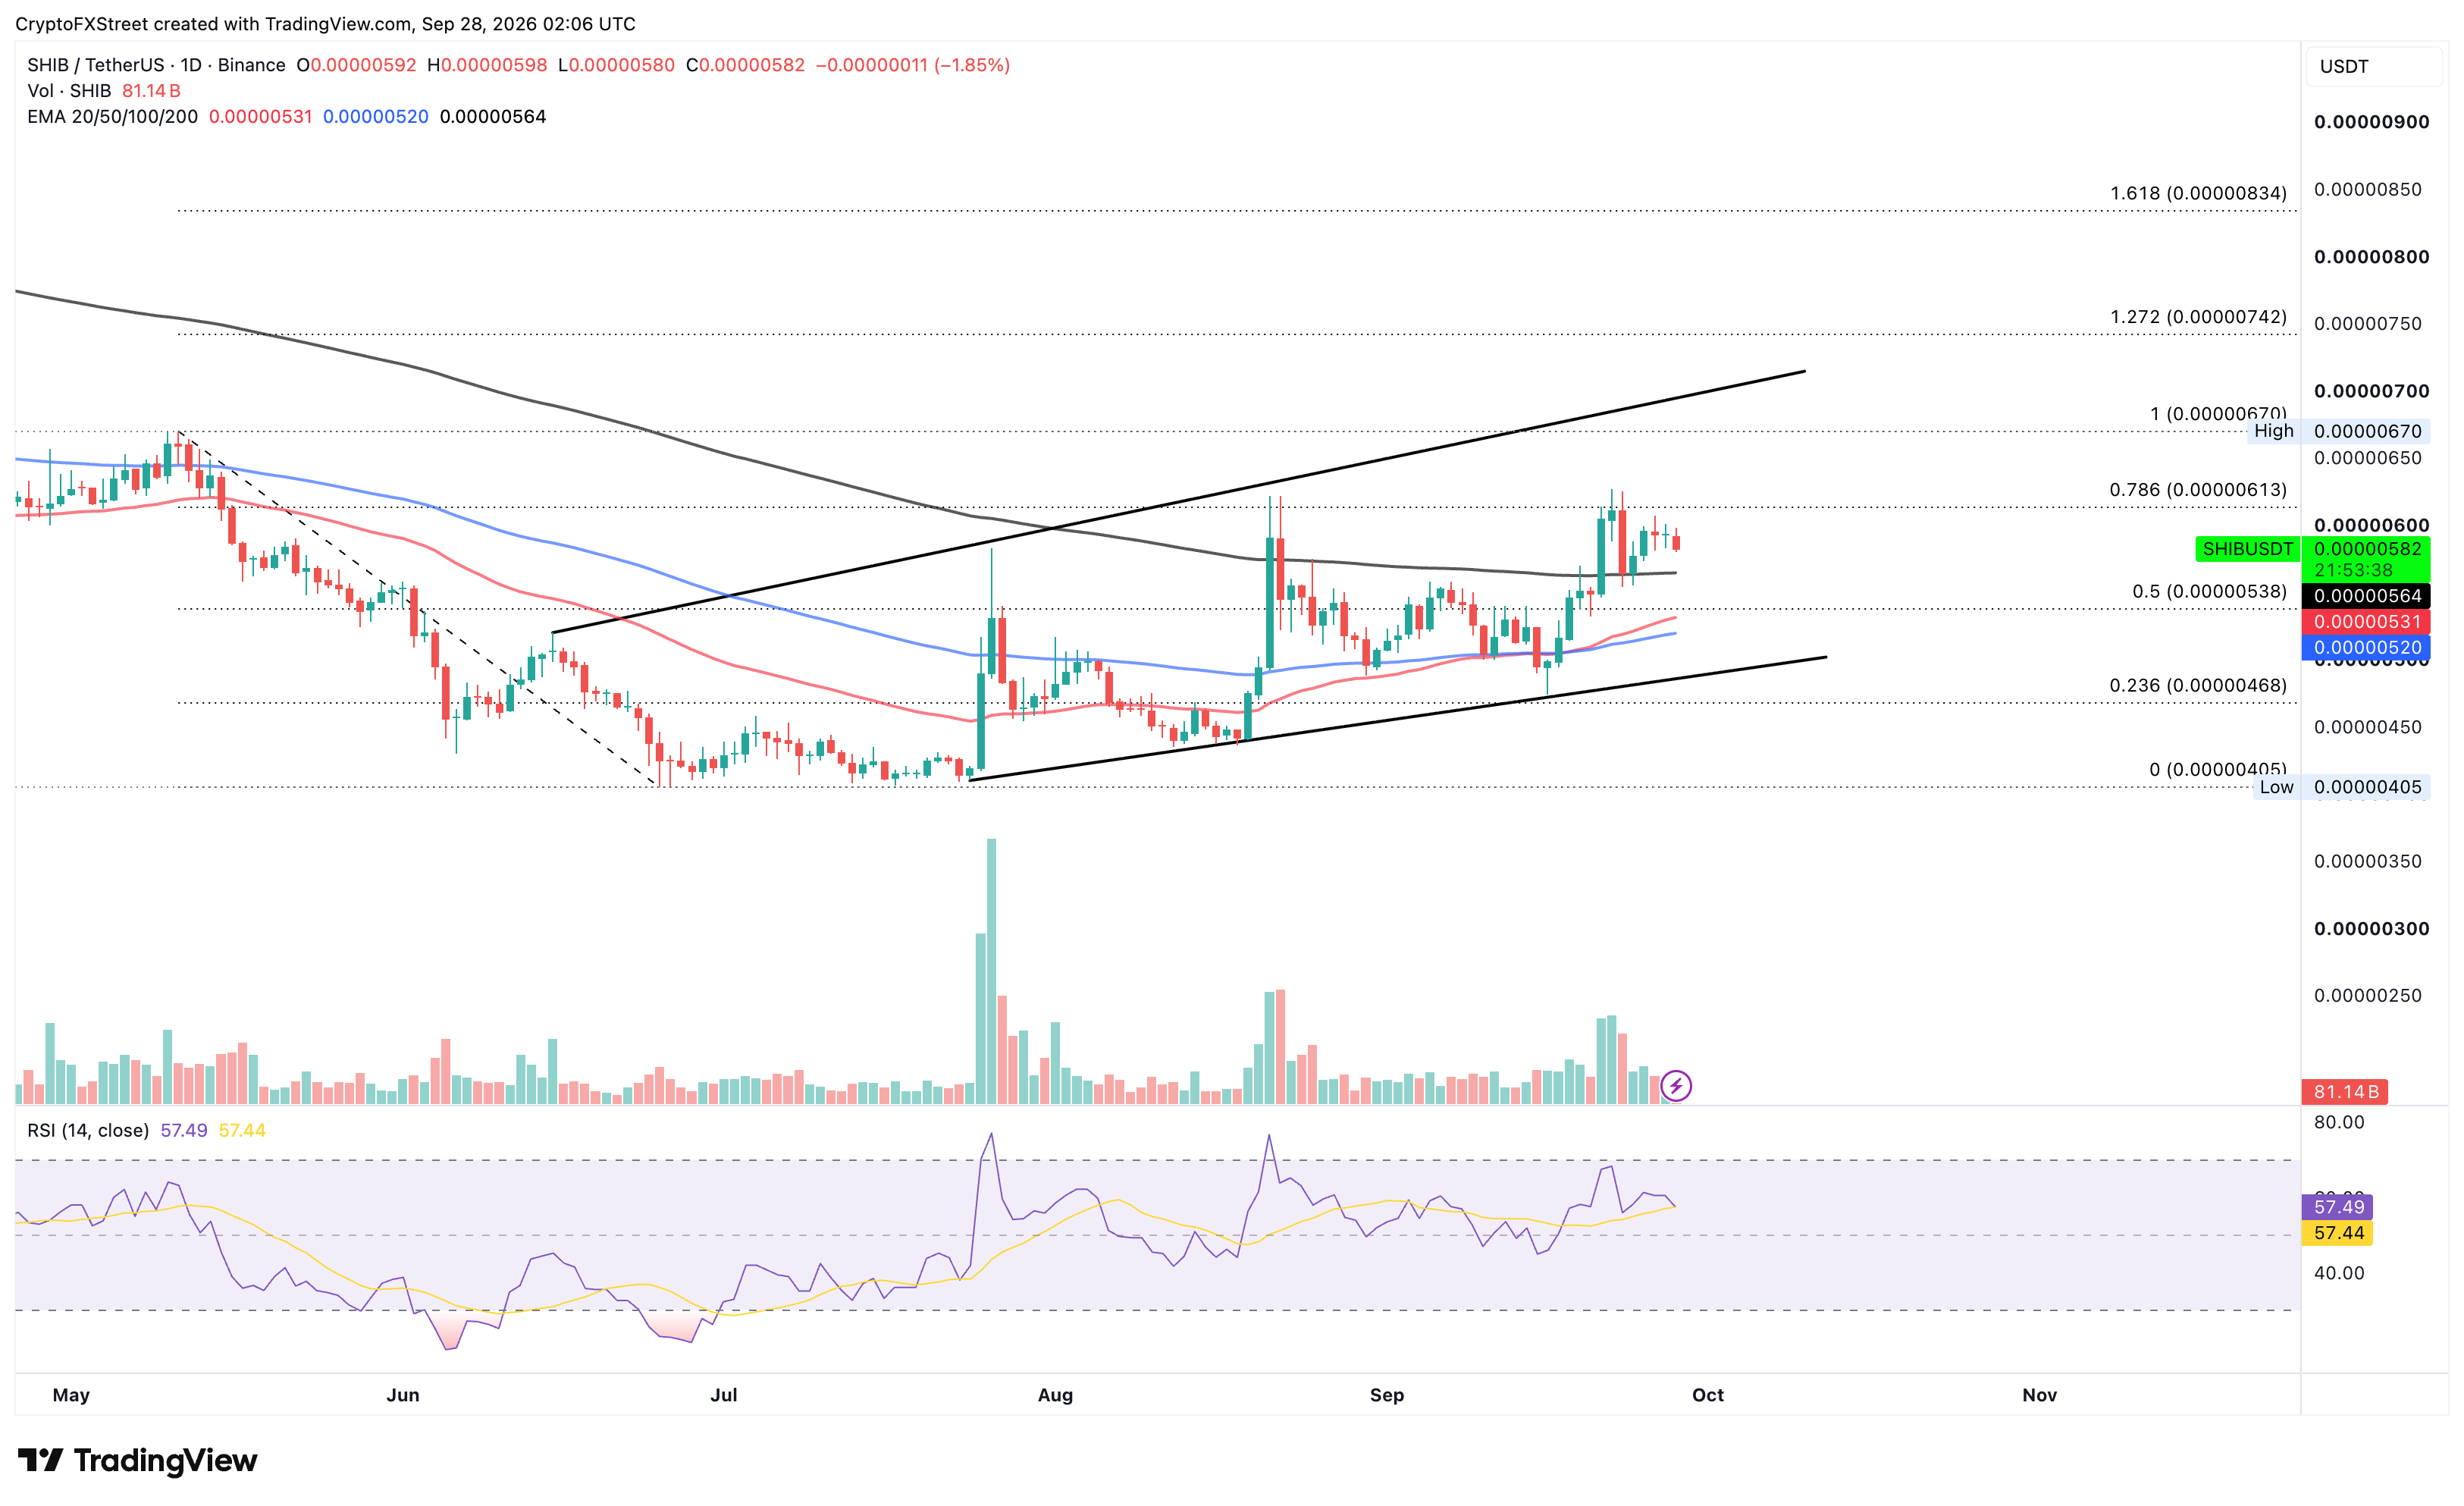
SHIB/USDT daily price chart.

A decisive close below the 200-day EMA at $0.00000564 could target the 50% retracement level at $0.00000538, with support from the 50- and 100-day EMAs at $0.00000531 and $0.00000520, respectively.

Pepe struggles to extend its trendline breakout rally

Pepe hovers above $0.00000400 at press time on Monday, trading in the red after a 9% rebound the previous week. The meme coin reflects an easing in bullish recovery as the price remains capped below the $0.00000500 psychological level.

The 127.2% Fibonacci extension level, measured from $0.00000456 to $0.00000320, at $0.00000502 reinforces the upside barrier. A confirmed breakout above this level could renew the bullish trend, targeting the 161.8% extension level at $0.00000567. The RSI eases to 57 on the daily chart, reaffirming the reduced upside traction.
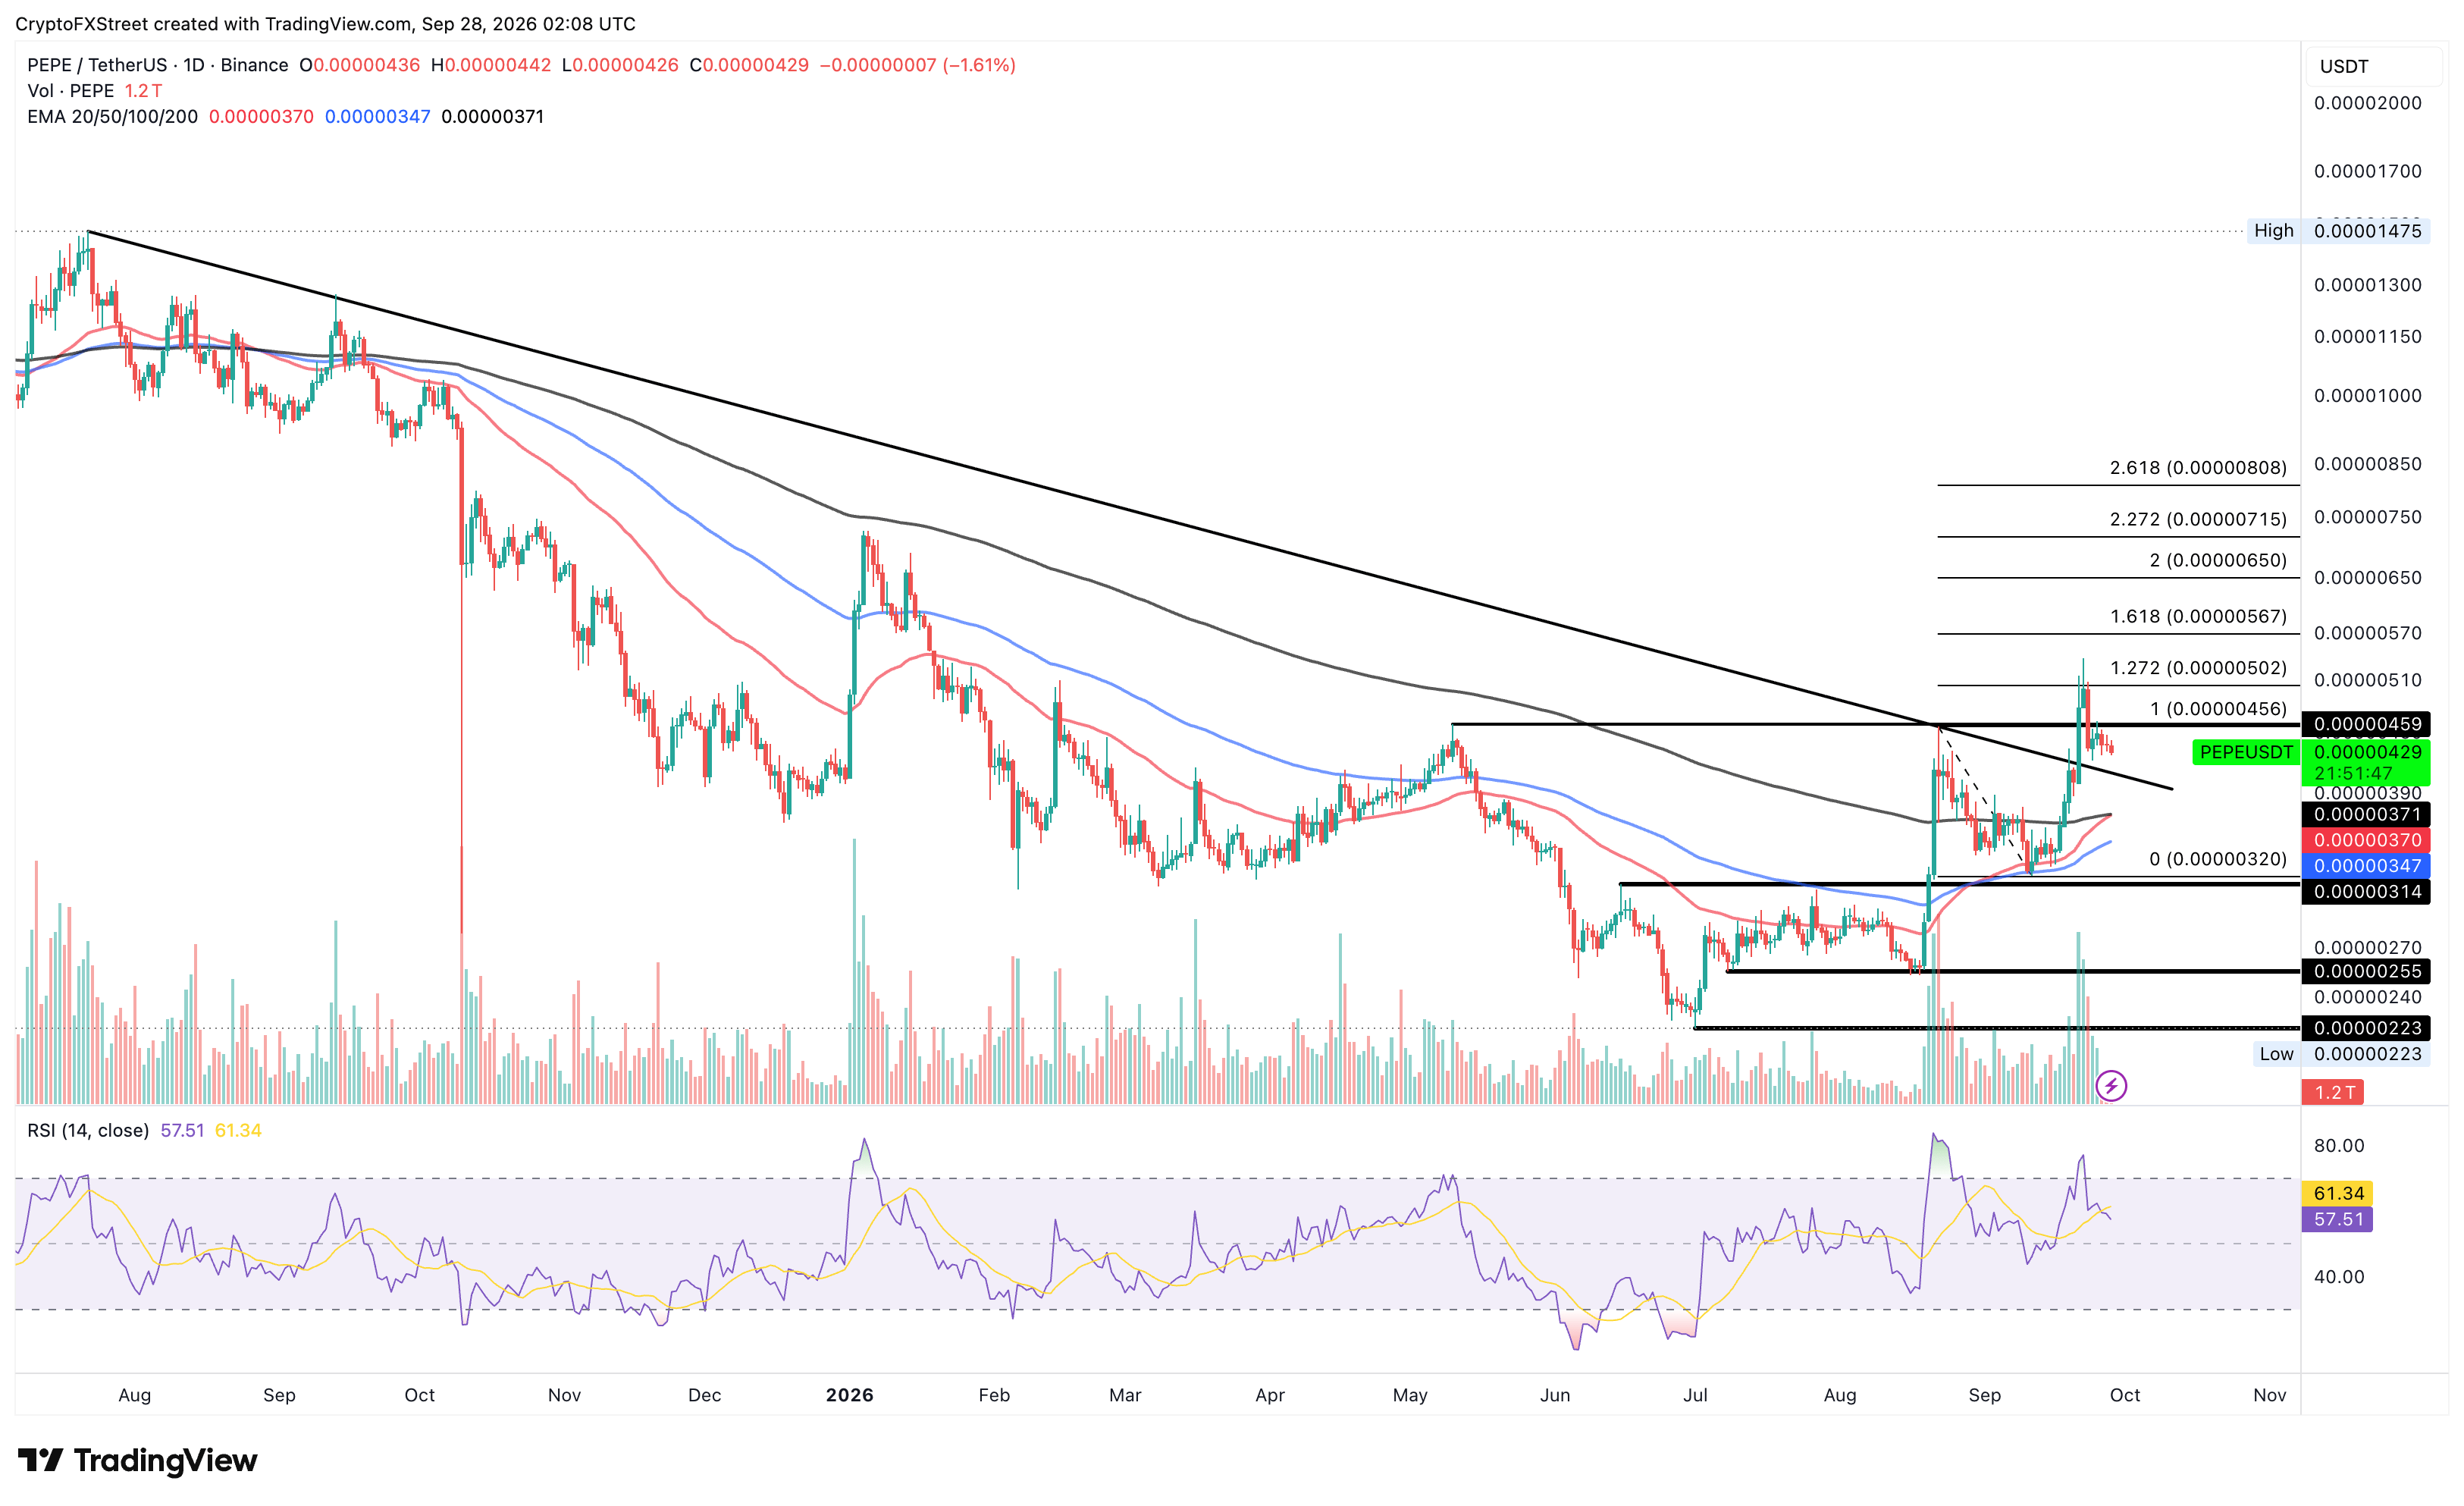
PEPE/USDT daily price chart.

Looking down, the initial support for PEPE aligns with the broken trendline near $0.00000420. Any deeper pullback could nullify the chances of extending the breakout rally, targeting the 200- and 50-day EMAs around $0.00000370 and $0.00000371, which are on the verge of forming a Golden Cross.

(The technical analysis of this story was written with the help of an AI tool. Know more.)

Disclaimer: For information purposes only. Past performance is not indicative of future results.
placeholder
October hike odds climb toward 60% as Goldman and BofA both flip — what Warsh's "dose of accommodation" really changedRate futures now price roughly 55% to 62% for a 25bp hike at the October 27-28 FOMC, up from about 30% before Chair Warsh's post-meeting framing that the Fed is merely "removing some accommodation." Goldman Sachs has added an October hike to its forecast and Bank of America now sees moves in both October and December. Here is the repricing, the language behind it, and the two data points that decide it.
Author  Irene Q.
Sep 23, Wed
Rate futures now price roughly 55% to 62% for a 25bp hike at the October 27-28 FOMC, up from about 30% before Chair Warsh's post-meeting framing that the Fed is merely "removing some accommodation." Goldman Sachs has added an October hike to its forecast and Bank of America now sees moves in both October and December. Here is the repricing, the language behind it, and the two data points that decide it.
placeholder
Four jobs reports in five days: what JOLTS, ADP, claims and the September payrolls mean for the October Fed decisionThe US labour market faces its densest data week of the month. JOLTS job openings land Tuesday (7.2 million expected), ADP on Wednesday (70,000 expected), initial claims on Thursday and the September non-farm payrolls on Friday (100,000 expected, down from 162,000). Markets price a 64%-70% chance of another quarter-point Fed hike on October 28. The dollar index sits at 100.77 and the S&P 500 at 7,729.8.
Author  Mitrade
Sep 28, Mon
The US labour market faces its densest data week of the month. JOLTS job openings land Tuesday (7.2 million expected), ADP on Wednesday (70,000 expected), initial claims on Thursday and the September non-farm payrolls on Friday (100,000 expected, down from 162,000). Markets price a 64%-70% chance of another quarter-point Fed hike on October 28. The dollar index sits at 100.77 and the S&P 500 at 7,729.8.
placeholder
【Daily Brief】30-year Treasury tops 5.59%, S&P 500 slips to 7,670 and gold holds $4,180 — PCE lands tonightThe 30-year Treasury yield closed at 5.59%, its highest since June 2002, and the Dow fell 131.59 points to 51,349.92. US consumer confidence dropped to 81.9, a 12-year low, and JOLTS job openings fell to 7.1 million. August PCE and Q3 GDP both land at 8:30am ET tonight.
Author  Suzie
Sep 30, Wed
The 30-year Treasury yield closed at 5.59%, its highest since June 2002, and the Dow fell 131.59 points to 51,349.92. US consumer confidence dropped to 81.9, a 12-year low, and JOLTS job openings fell to 7.1 million. August PCE and Q3 GDP both land at 8:30am ET tonight.
placeholder
Gold falls to near $4,150 as higher Treasury yields, oil prices outweigh softer PCE inflationGold price (XAU/USD) tumbles to near $4,150 during the early Asian session on Thursday, pressured by elevated US Treasury bond yields. Traders await the US September employment data for fresh impetus, which will be released later on Friday. 
Author  FXStreet
Yesterday 01: 26
Gold price (XAU/USD) tumbles to near $4,150 during the early Asian session on Thursday, pressured by elevated US Treasury bond yields. Traders await the US September employment data for fresh impetus, which will be released later on Friday. 
placeholder
United States Dollar Index sits near March 2025 highs, above 102.00 ahead of US NFPThe US Dollar Index (DXY), which tracks the Greenback against a basket of currencies, attracts buyers for the fifth straight day and climbs back above the 102.00 mark during the Asian session on Friday.
Author  FXStreet
7 hours ago
The US Dollar Index (DXY), which tracks the Greenback against a basket of currencies, attracts buyers for the fifth straight day and climbs back above the 102.00 mark during the Asian session on Friday.
Related Instrument
goTop
quote