


Bitcoin Price Forecast: BTC extends pullback as profit-taking weighs
- Bitcoin trades below $84,000 on Thursday after falling 2% the previous day, with profit-taking adding to downside pressure.
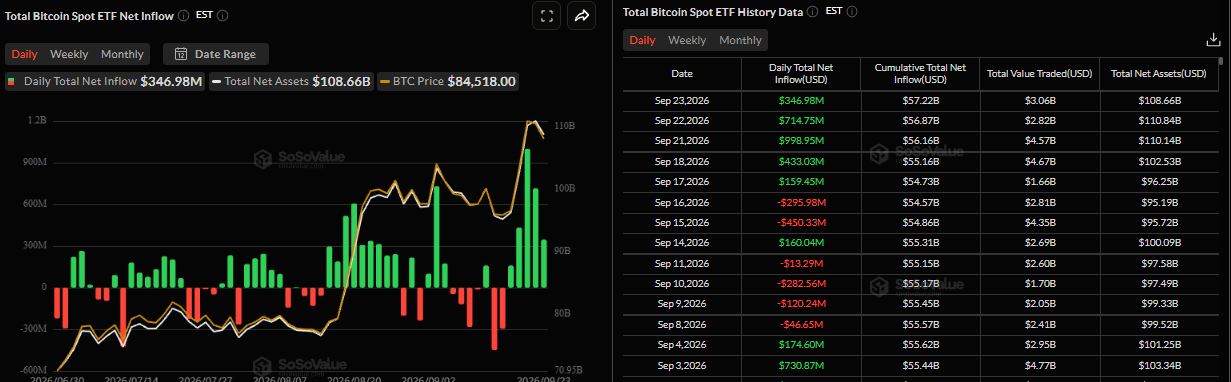
- US-listed spot ETF recorded an inflow of $346.98 million on Wednesday, marking five consecutive days of positive flows.
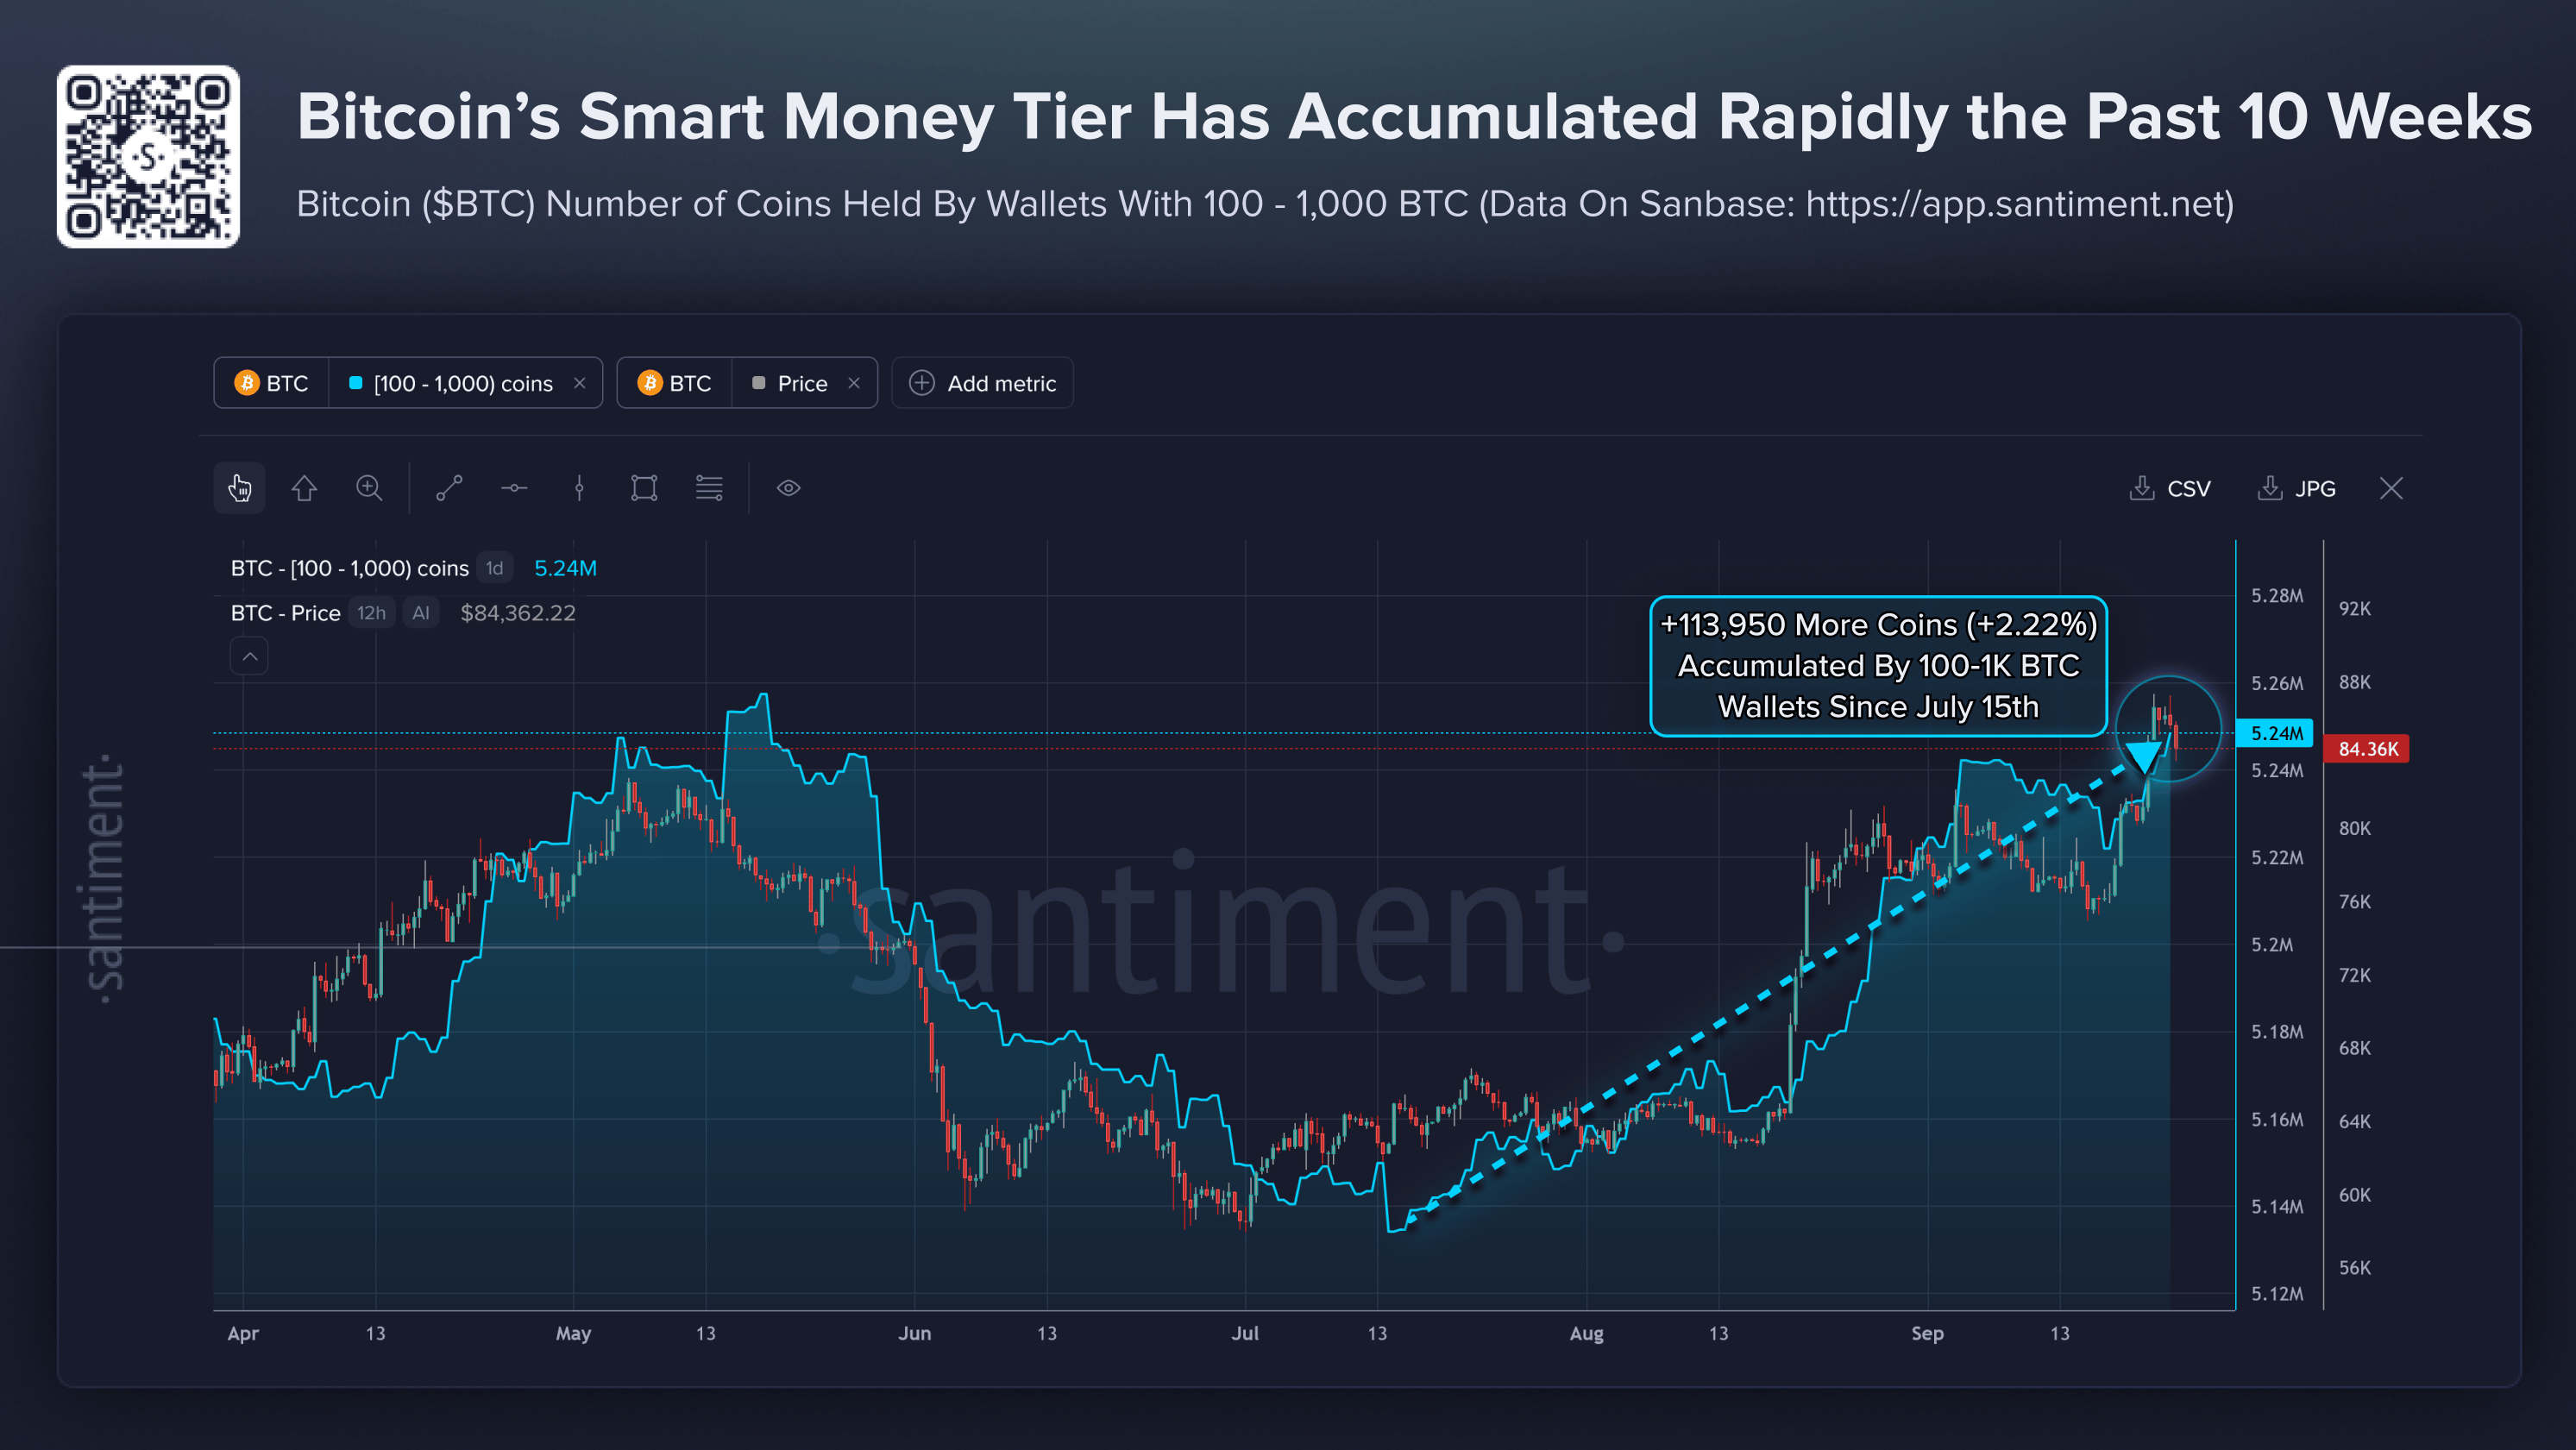
- Sustained accumulation by the 100–1,000 BTC holder cohort has historically provided valuable market signals and could support BTC.
Bitcoin (BTC) trades below $84,000 at the time of writing on Thursday, extending the pullback for the third consecutive day as profit-taking weighs in. Despite the price correction, strong institutional demand alongside sustained accumulation by the 100–1,000 BTC holder cohort could support the Crypto King.
Profit-taking adds downside pressure to BTC
Bitcoin surged 6.7% at the start of this week on Monday, climbing to a high of $87,395, its highest level since the end of January, before profit-taking emerged.
As highlighted in the previous report, BTC’s Network Realized Profit/Loss (NPL) metric spiked sharply on Monday, reaching its highest level since December 12, 2025. This spike indicates that holders are, on average, selling their bags at a significant profit, thereby increasing the selling pressure.
The rise in profit-taking has since weighed on the Crypto King’s price, with BTC falling below $84,000 and posting losses for three consecutive days as of Thursday.
 [14-1790246569683.46.11, 24 Sep, 2026].png)
Robust institutional demand
Despite profit-taking, institutional demand has remained strong so far this week. SoSoValue data showed that spot Bitcoin ETFs recorded an inflow of $346.98 million on Wednesday, marking the fifth consecutive day of inflows since last week and highlighting robust investor demand. If these inflows continue and intensify through the week, BTC could extend the ongoing rally.
Smart wallets keep accumulating BTC
Santiment reported on Thursday that the “BTC rally may not be over,” highlighting continued accumulation among wallets holding between 100 and 1,000 BTC.
According to the report, these wallets have added 113,950 BTC since July 15, increasing their collective holdings by 2.22% to roughly 5.24 million BTC.
The analyst noted that “this wallet tier has historically been one of Bitcoin’s most useful smart money groups to watch. Santiment’s five-year analysis found 100-1,000 BTC wallets particularly have correlated quite closely with crypto market direction, with accumulation often appearing before or during stronger price periods.”
The latest accumulation is particularly notable because it has continued alongside Bitcoin’s sharp recovery since mid-August. This suggests the rally has been supported by larger, well-capitalized holders rather than driven solely by retail buying.
Sustained buying from this wallet group has historically been valuable alpha, especially when paired with retail fear, sentiment, and exchange-flow data. Continued buying from this group could provide important support if broader demand remains strong.
Bitcoin technical outlook: Slides below $84,000
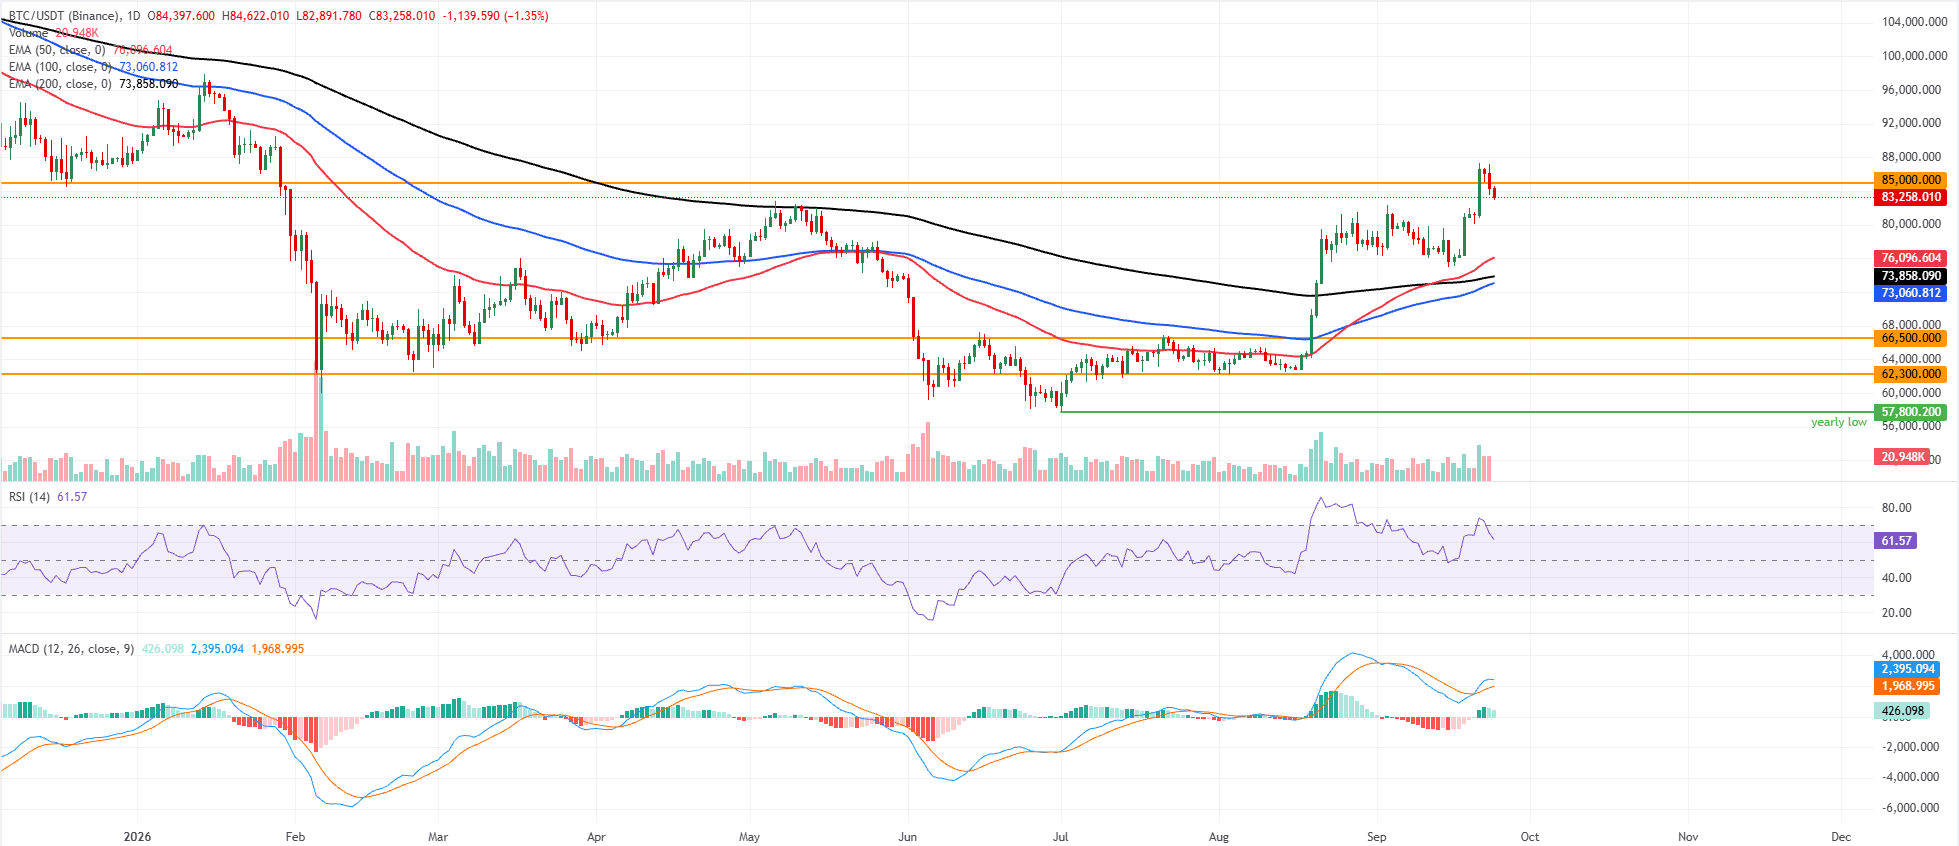
Bitcoin price trades at $83,360 at the time of writing on Thursday, extending the correction for the third consecutive day. Despite the pullback, BTC maintains a bullish near‑term bias as it holds well above the 50-day, 100-day and 200-day Exponential Moving Averages (EMAs) clustered between roughly $73,000 and $76,000.
The broader uptrend remains intact, with the Relative Strength Index (RSI) around 62 on the daily chart, pointing to firm but not extreme bullish momentum. At the same time, the Moving Average Convergence Divergence (MACD) histogram stays in positive territory, suggesting upside pressure remains despite the recent decline from the latest highs.
On the topside, initial resistance emerges at the horizontal barrier near $85,000, where a clear break would open the way for a higher rise into the $100,000 mark.
On the downside, immediate demand is expected around the current price area, followed by stronger structural support at the 50-day EMA at $76,096, the 200-day EMA at $73,858 and the 100-day EMA at $73,060. A deeper retracement toward the horizontal floors at $66,500 and $62,300 would still leave the broader bullish structure intact but signal a more extended corrective phase.
(The technical analysis of this story was written with the help of an AI tool. Know more.)
Bitcoin, altcoins, stablecoins FAQs
Bitcoin is the largest cryptocurrency by market capitalization, a virtual currency designed to serve as money. This form of payment cannot be controlled by any one person, group, or entity, which eliminates the need for third-party participation during financial transactions.
Altcoins are any cryptocurrency apart from Bitcoin, but some also regard Ethereum as a non-altcoin because it is from these two cryptocurrencies that forking happens. If this is true, then Litecoin is the first altcoin, forked from the Bitcoin protocol and, therefore, an “improved” version of it.
Stablecoins are cryptocurrencies designed to have a stable price, with their value backed by a reserve of the asset it represents. To achieve this, the value of any one stablecoin is pegged to a commodity or financial instrument, such as the US Dollar (USD), with its supply regulated by an algorithm or demand. The main goal of stablecoins is to provide an on/off-ramp for investors willing to trade and invest in cryptocurrencies. Stablecoins also allow investors to store value since cryptocurrencies, in general, are subject to volatility.
Bitcoin dominance is the ratio of Bitcoin's market capitalization to the total market capitalization of all cryptocurrencies combined. It provides a clear picture of Bitcoin’s interest among investors. A high BTC dominance typically happens before and during a bull run, in which investors resort to investing in relatively stable and high market capitalization cryptocurrency like Bitcoin. A drop in BTC dominance usually means that investors are moving their capital and/or profits to altcoins in a quest for higher returns, which usually triggers an explosion of altcoin rallies.
Recommended Articles


