


XRP undergoes a healthy correction following recent gains
- XRP steadies around $1.500 on Thursday after falling 4.56% the previous day while remaining within a broader uptrend.
- Santiment data shows that certain whales are accumulating XRP tokens.
- Strong institutional demand and rising network growth support further gains for XRP.
Ripple (XRP) steadies around $1.500 at the time of writing on Thursday after declining over 4% the previous day. XRP is undergoing a healthy correction after its recent gains. Despite the pullback, XRP remains within a broader uptrend, while whale accumulation, strong institutional demand and rising network activity could extend further gains.
Whales accumulate XRP tokens
Santiment’s Supply Distribution data shows certain large-wallet holders (whales) buying XRP, supporting a positive outlook for the token.
The metric indicates that whales holding between 10 million and 100 million tokens (blue line in the chart below) and holders of 100,000 to 1 million tokens (red line) have accumulated 350 million tokens since Sunday. During the same period, holders of 1 million to 10 million tokens (yellow line) shed 50 million tokens. This suggests accumulation among larger holders and smaller whale cohorts has outweighed selling from the mid-sized cohort, indicating a mixed but broadly supportive accumulation trend for Ripple.
 [09-1790232650302.23.06, 24 Sep, 2026].png)
In addition, Santiment data shows XRP’s network growth index — a key metric tracking user adoption and project traction — surged to 12,608 on Wednesday, the highest level since February 10. These elevated levels still highlight a broadly bullish outlook for XRP.
 [09-1790232675412.25.57, 24 Sep, 2026].png)
Institutional demand remains robust
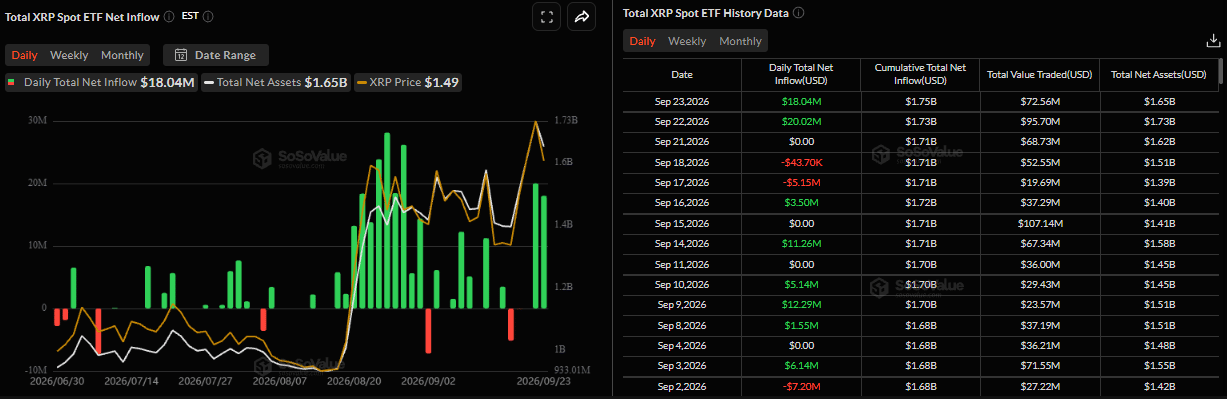
SoSoValue data showed that spot XRP ETFs recorded an inflow of $18.04 million on Wednesday, after a $20.02 million inflow the previous day, highlighting strong investor demand. If these inflows continue and intensify through the week, XRP could extend the ongoing rally.
Some signs of caution
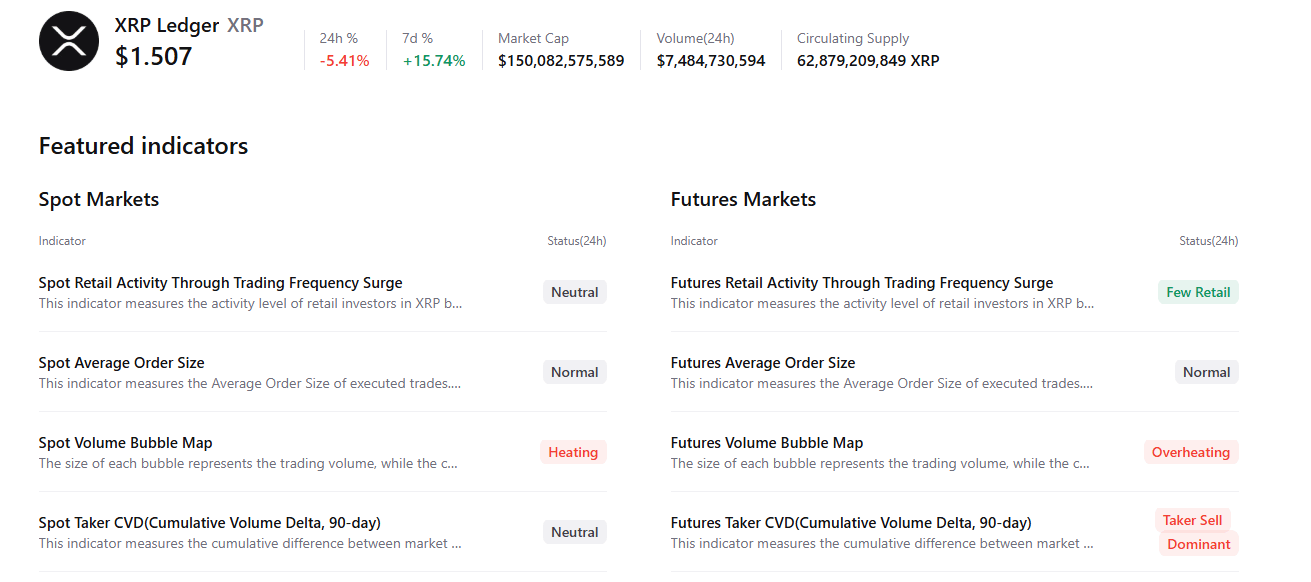
However, CryptoQuant’s summary data shows cautious signs. XRP’s futures markets show sell-side dominance and overheating conditions, with few retail investors actively following the massive price rally. In addition, spot markets show heating conditions while other metrics remain neutral, highlighting a mildly bearish, cautious sentiment bias among XRP traders.
XRP technical outlook: Holds above key support zone
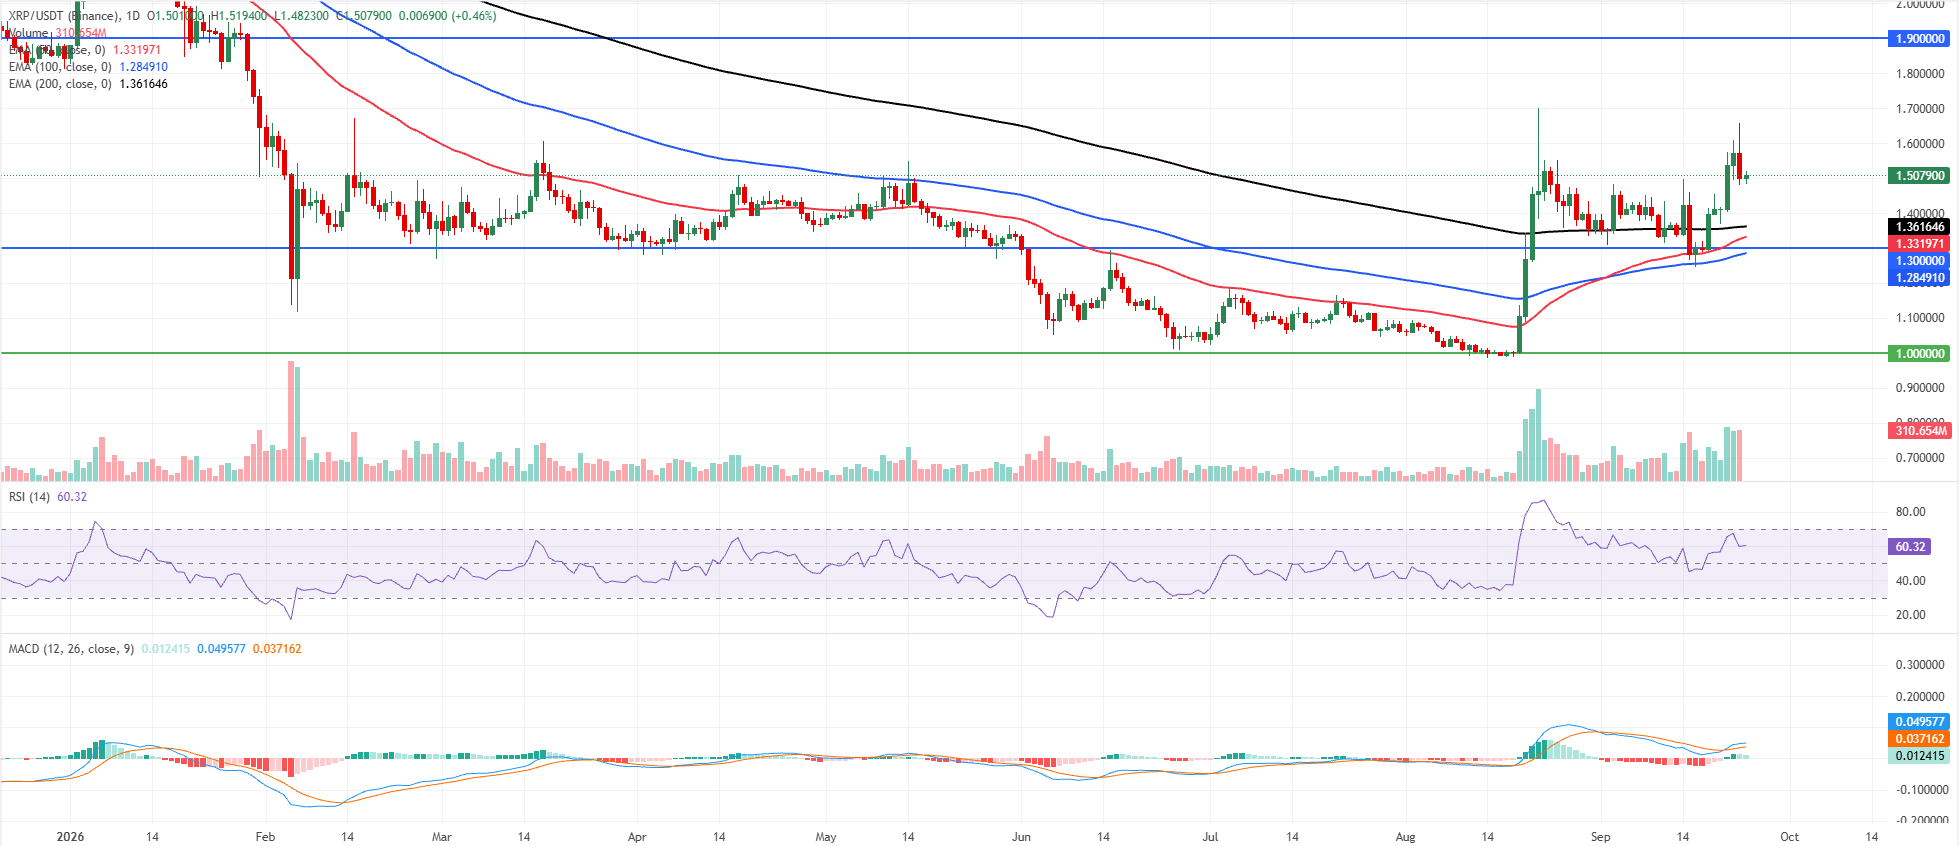
XRP price trades at $1.507 at the time of writing on Thursday after falling over 4% the previous day. Despite the pullback, XRP trades firmly above the 50-day, 100-day, and 200-day Exponential Moving Averages (EMAs) at $1.331, $1.284, and $1.361, respectively, reinforcing a bullish near-term bias.
The cluster of EMAs below price suggests a well-supported uptrend, while the Relative Strength Index (RSI) around 60 on the daily chart keeps momentum constructive but shy of overbought territory. The Moving Average Convergence Divergence (MACD) indicator remains positive, with the line above its signal and a modestly positive histogram, suggesting upward pressure remains, though not aggressively.
On the downside, immediate support sits around $1.506, followed by the 200-day EMA near $1.361 and the 50-day EMA at $1.331, with a more structural floor at $1.300. Deeper losses would expose the 100-day EMA at $1.284 and then the stronger base near $1.000.
On the topside, the next notable resistance is the horizontal barrier around $1.900, where bullish attempts could meet profit-taking unless momentum strengthens further.
(The technical analysis of this story was written with the help of an AI tool. Know more.)
Crypto ETF FAQs
An Exchange-Traded Fund (ETF) is an investment vehicle or an index that tracks the price of an underlying asset. ETFs can not only track a single asset, but a group of assets and sectors. For example, a Bitcoin ETF tracks Bitcoin’s price. ETF is a tool used by investors to gain exposure to a certain asset.
Yes. The first Bitcoin futures ETF in the US was approved by the US Securities & Exchange Commission in October 2021. A total of seven Bitcoin futures ETFs have been approved, with more than 20 still waiting for the regulator’s permission. The SEC says that the cryptocurrency industry is new and subject to manipulation, which is why it has been delaying crypto-related futures ETFs for the last few years.
Yes. The SEC approved in January 2024 the listing and trading of several Bitcoin spot Exchange-Traded Funds, opening the door to institutional capital and mainstream investors to trade the main crypto currency. The decision was hailed by the industry as a game changer.
The main advantage of crypto ETFs is the possibility of gaining exposure to a cryptocurrency without ownership, reducing the risk and cost of holding the asset. Other pros are a lower learning curve and higher security for investors since ETFs take charge of securing the underlying asset holdings. As for the main drawbacks, the main one is that as an investor you can’t have direct ownership of the asset, or, as they say in crypto, “not your keys, not your coins.” Other disadvantages are higher costs associated with holding crypto since ETFs charge fees for active management. Finally, even though investing in ETFs reduces the risk of holding an asset, price swings in the underlying cryptocurrency are likely to be reflected in the investment vehicle too.
Recommended Articles


