

Dogecoin, Shiba Inu and Pepe slide as meme coin correction gathers pace

Source Fxstreet
  • Dogecoin trades in red on Monday after falling over 6% in the previous week.
  • Shiba Inu closes below the lower boundary of its consolidation range around $0.000056, signaling a deeper correction.
  • Pepe slips near the daily support at $0.0000035, a firm close below suggests further losses.

Meme coins remain under pressure on Monday as Dogecoin (DOGE), Shiba Inu (SHIB) and Pepe (PEPE) struggle after losing over 6%, 2% and 2.5% in the previous week. DOGE and SHIB slip below their key support zone. Meanwhile, PEPE edges toward the support zone, where a close below would suggest a deeper correction.

Dogecoin faces rejection from key resistance zones

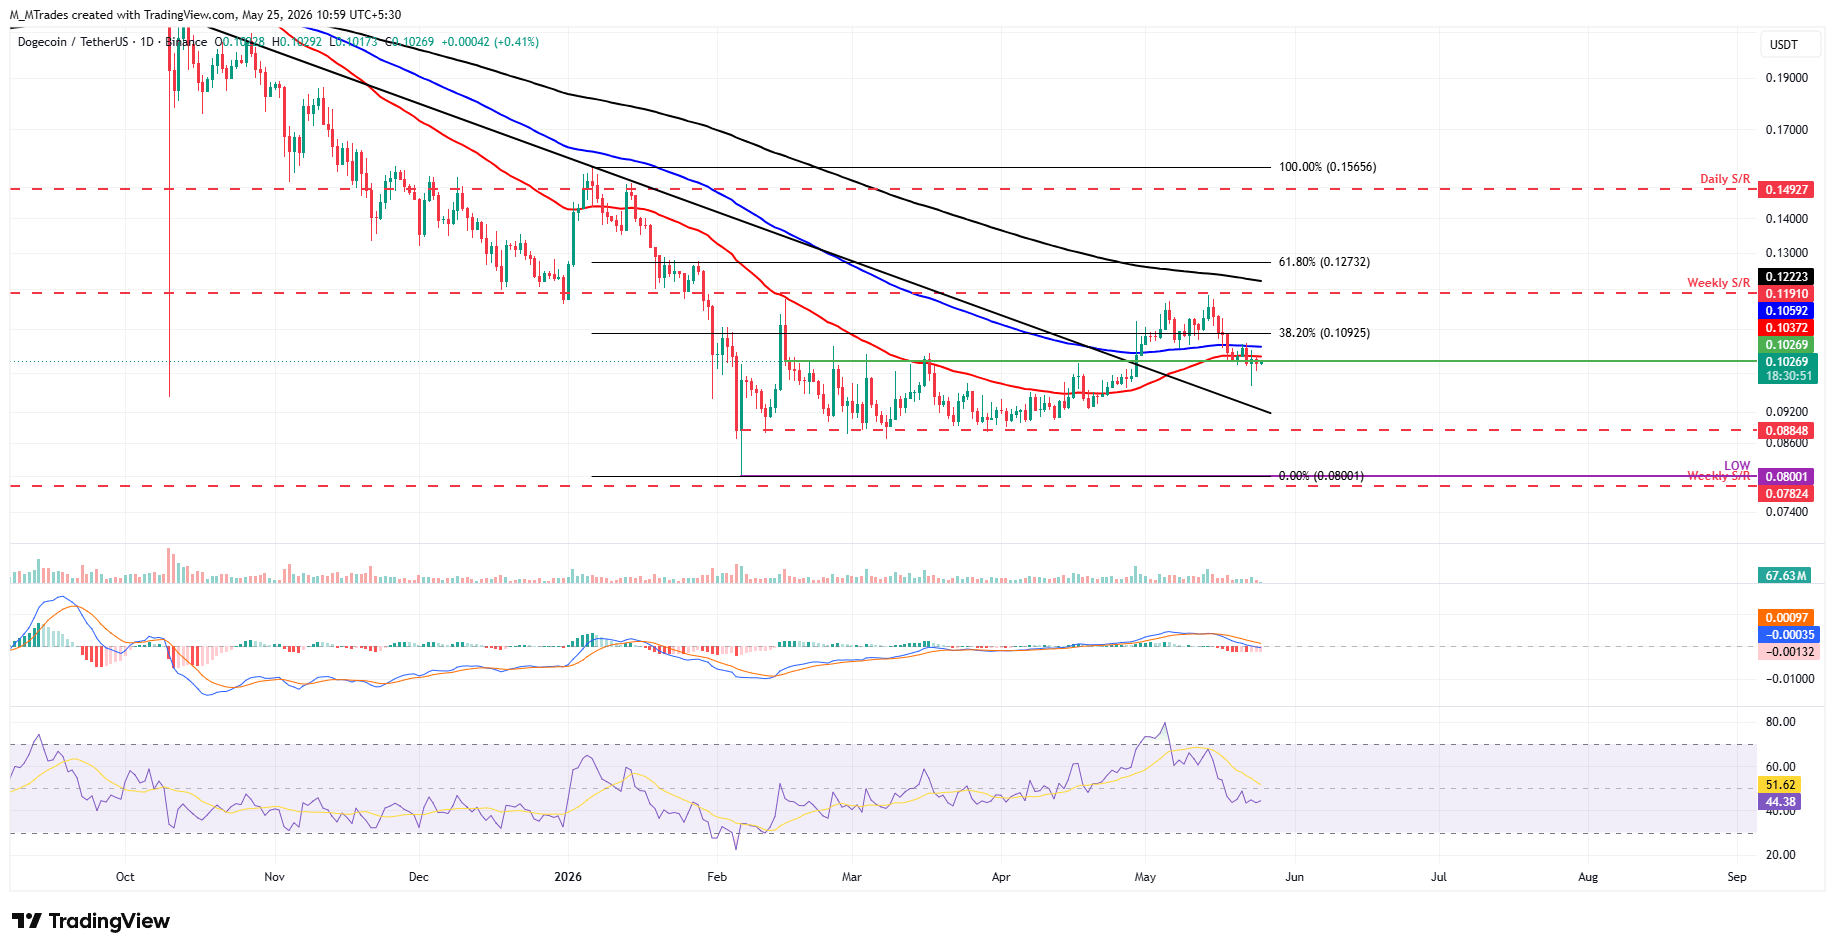
Dogecoin’s price failed to close above the key 100-day Exponential Moving Average (EMA) at $0.105 on Thursday and declined by over 3% the next day. DOGE closed below the 50-day EMA at $0.103 and struggled below it during the week. At the time of writing on Monday, DOGE trades below this resistance at $0.102.

If DOGE continues to correct, it could extend the losses toward the key psychological level at $0.100.

The Relative Strength Index (RSI) on the daily chart reads 44, below the neutral level of 50, indicating bearish momentum gaining traction. The Moving Average Convergence Divergence (MACD) also showed a bearish crossover on May 16, which remains intact, supporting the bearish outlook.
DOGE/USDT daily chart

However, if DOGE recovers, it could extend the advance toward the 100-day EMA at $0.105.

Shiba Inu closes below the lower consolidation boundary

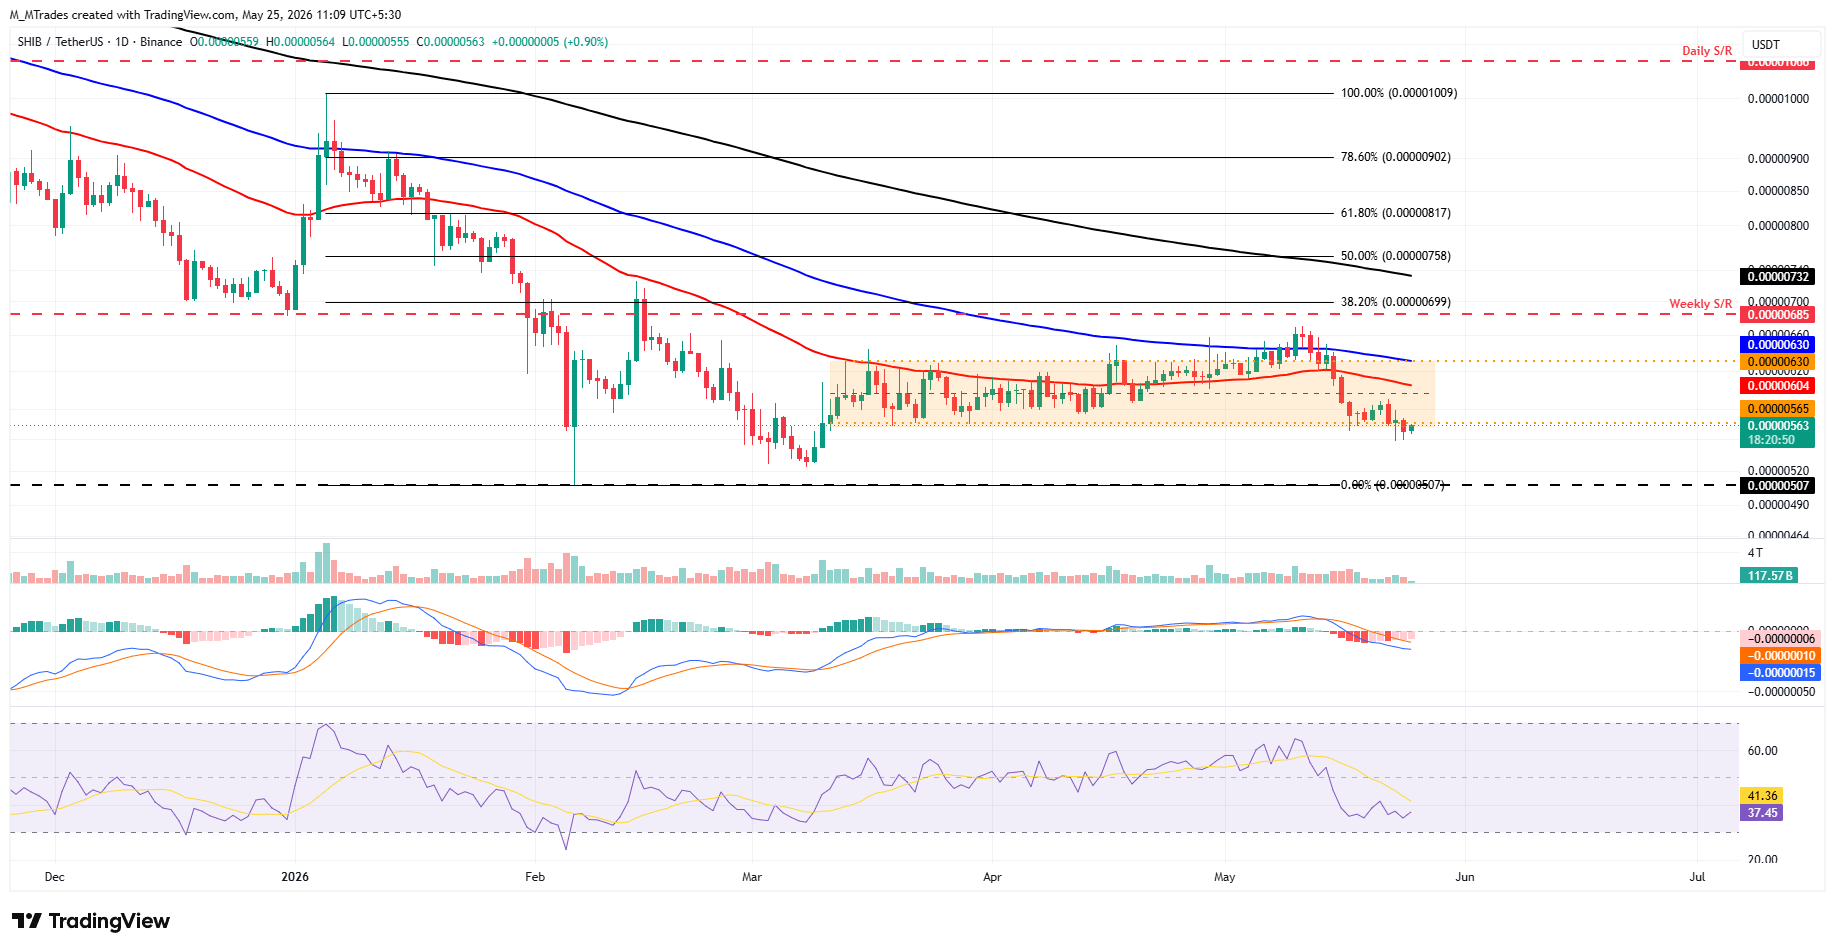
Shiba Inu corrected over 2% and closed below the lower boundary of the consolidation range at $0.0000056 in the previous week. At the time of writing on Monday, SHIB is retesting this previously broken zone.

If SHIB faces rejection at $0.0000056, it could extend losses toward the February 6 low at $0.0000050.

Like Dogecoin, SHIB’s momentum indicators, RSI and MACD, show bearish momentum gaining traction.
SHIB/USDT daily chart

On the other hand, if SHIB recovers, it could extend the advance toward the 50-day EMA at $0.0000060.

Pepe could extend losses if it closes below key support

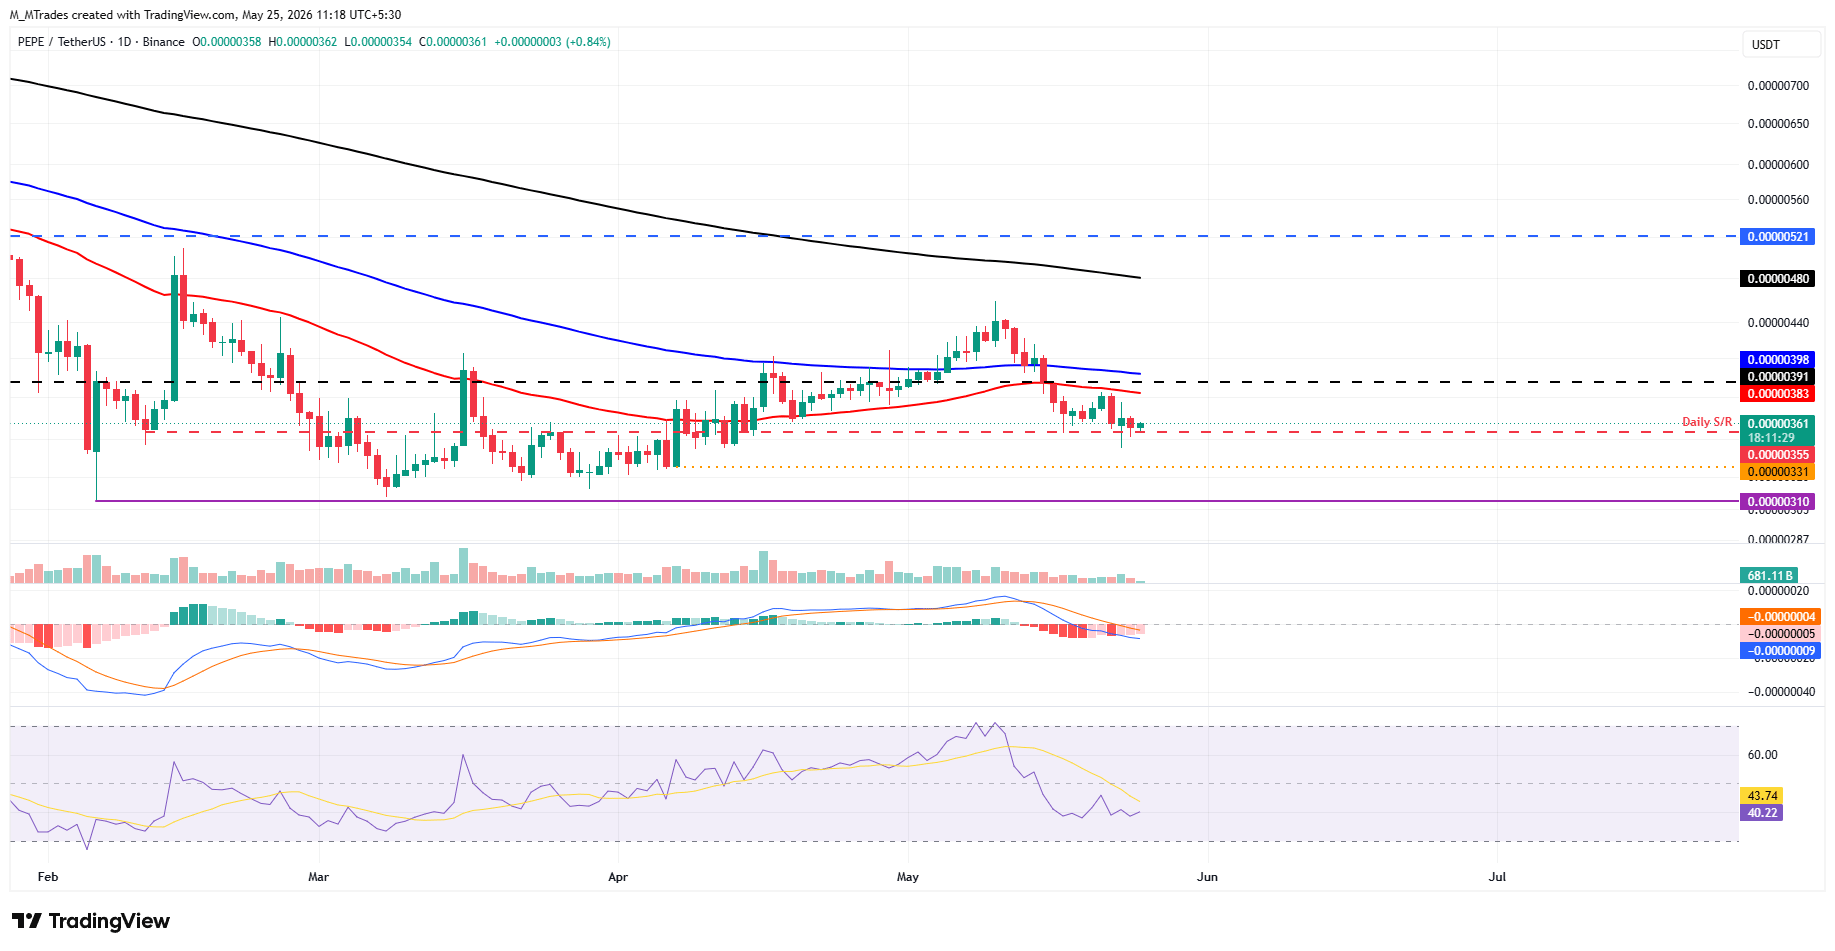
Pepe price corrected over 2.7% last week and retested the daily support at $0.0000036 on Monday.

If PEPE closes below the daily support at $0.0000036, it could extend the losses toward the April 7 low at $0.0000033.

Like Dogecoin and Shiba Inu, Pepe’s momentum indicators, RSI and MACD, also support a negative outlook.
PEPE/USDT daily chart

If PEPE recovers, it could extend the recovery toward the 50-day EMA at $0.0000038.

Disclaimer: For information purposes only. Past performance is not indicative of future results.
placeholder
Markets in 2026: Will gold, Bitcoin, and the U.S. dollar make history again? — These are how leading institutions thinkAfter a turbulent 2025, what lies ahead for commodities, forex, and cryptocurrency markets in 2026?
Author  Insights
Dec 25, 2025
After a turbulent 2025, what lies ahead for commodities, forex, and cryptocurrency markets in 2026?
placeholder
ECB Policy Outlook for 2026: What It Could Mean for the Euro’s Next MoveWith the ECB likely holding rates steady at 2.15% and the Fed potentially extending cuts into 2026, EUR/USD may test 1.20 if Eurozone growth proves resilient, but weaker growth and an ECB pivot could pull the pair back toward 1.13 and potentially 1.10.
Author  Mitrade
Dec 26, 2025
With the ECB likely holding rates steady at 2.15% and the Fed potentially extending cuts into 2026, EUR/USD may test 1.20 if Eurozone growth proves resilient, but weaker growth and an ECB pivot could pull the pair back toward 1.13 and potentially 1.10.
placeholder
Gold Price Forecast: XAU/USD climbs to near $4,350 on Fed rate cut bets, geopolitical risks Gold price (XAU/USD) rises to near $4,345 during the early Asian session on Friday. Gold finished 2025 with a significant rally, achieving an annual gain of around 65%, its biggest annual gain since 1979.
Author  FXStreet
Jan 02, Fri
Gold price (XAU/USD) rises to near $4,345 during the early Asian session on Friday. Gold finished 2025 with a significant rally, achieving an annual gain of around 65%, its biggest annual gain since 1979.
placeholder
My Top 5 Stock Market Predictions for 2026Five 2026 market predictions written in a native, news-style voice: AI’s winners and losers, broader sector leadership, dividend demand, valuation cooling as the Shiller CAPE sits at 39 (Dec. 31, 2025), and quantum-computing bursts—while keeping all original facts and numbers unchanged.
Author  Mitrade
Jan 06, Tue
Five 2026 market predictions written in a native, news-style voice: AI’s winners and losers, broader sector leadership, dividend demand, valuation cooling as the Shiller CAPE sits at 39 (Dec. 31, 2025), and quantum-computing bursts—while keeping all original facts and numbers unchanged.
placeholder
Gold Price Forecast: XAU/USD keeps looking for direction above $4,500Gold (XAU/USD) trades lower for the second consecutive day on Friday, but remains contained within previous ranges, with downside attempts limited above the $4,500 line for now.
Author  FXStreet
May 22, Fri
Gold (XAU/USD) trades lower for the second consecutive day on Friday, but remains contained within previous ranges, with downside attempts limited above the $4,500 line for now.
Related Instrument
goTop
quote