
Gold floats around $4,200 amid US Dollar slide and growing Fed-pivot bets
- Gold holds above $4,200 as ADP job losses and steady services activity keep traders leaning toward Fed easing.
- Rumors of Hassett replacing Powell pressure the US Dollar, pushing DXY to its lowest level since October.
- World Gold Council says central banks bought 53 tons in October, the strongest month of 2025, supporting bullion’s uptrend.
Gold price declines some 0.20% on Wednesday as US economic data, although mixed, reaffirmes traders’ expectations for a rate cut next week at the Fed's meeting. XAU/USD trades above $4,200 after bouncing off daily highss of $4,240.
Bullion declines after mixed US indicators, as fresh central bank buying reinforces speculation of a December rate cut
Earlier, data from ADP showed that private companies cut jobs in November amid an ongoing economic slowdown, as revealed by the latest reading of the ISM Manufacturing PMI data.
Meanwhile, business activity in the services sector remained stable, reported the ISM. Services businesses account for more than two-thirds of the US Gross Domestic Product (GDP) and were driven by higher-income households.
This, alongside rumors that the White House economic adviser Kevin Hassett could be the next Fed Chair, succeeding Jerome Powell, had pushed the Greenback to hit its lowest level since October.
The US Dollar Index (DXY), which tracks the American currency's performance against six other currencies, is down 0.44% to 98.87.
Despite this, Bullion declined for the second consecutive day, but it seems poised to test higher prices after the World Gold Council (WGC) revealed that central banks bought net 53 tons of Gold in October, so far, the strongest month of 2025.
Up next, the US economic schedule will feature Initial Jobless Claims for the week ending November 29, the Fed’s preferred inflation gauge, the Core Personal Consumption Expenditures (PCE) Price Index, and the University of Michigan Consumer Sentiment.
Daily market movers: Gold underpinned by central bank buying
- ADP data showed private firms cut 32,000 jobs in November, missing estimates of a 10,000 increase and down from October’s 49,000 gain.
- The US ISM Services PMI held steady in November at 52.6, up from 52.4 and surpassing the forecast of 52.1. While expansion continued, orders slowed, employment stayed weak, and input prices remained elevated.
- Money market instruments currently reflect an approximate 85% probability of a 25-basis point rate reduction, with the yield curve indicating 21.2 basis points of cuts at present. For 2026, investor expectations suggest 88.5 basis points of reductions, implying that the federal funds rate may conclude the year at 2.99%.
- After the data, the US 10-year Treasury Note yield is down 2 bps at 4.071%. US real yields — which correlate inversely to Gold prices, fall three basis points, down at 1.831%, a tailwind for Gold prices.
- The WGC reported that central banks resuming purchases in October. Krishan Gopaul, Senior Analyst, EMEA at the WGC said, “Central bank demand for gold remained robust in October, totaling 53t (+36% m/m) and continuing the strong trend seen throughout the year.” He added “Buying remained concentrated among a small number of central banks, led by the National Bank of Poland which became active again during the month.”
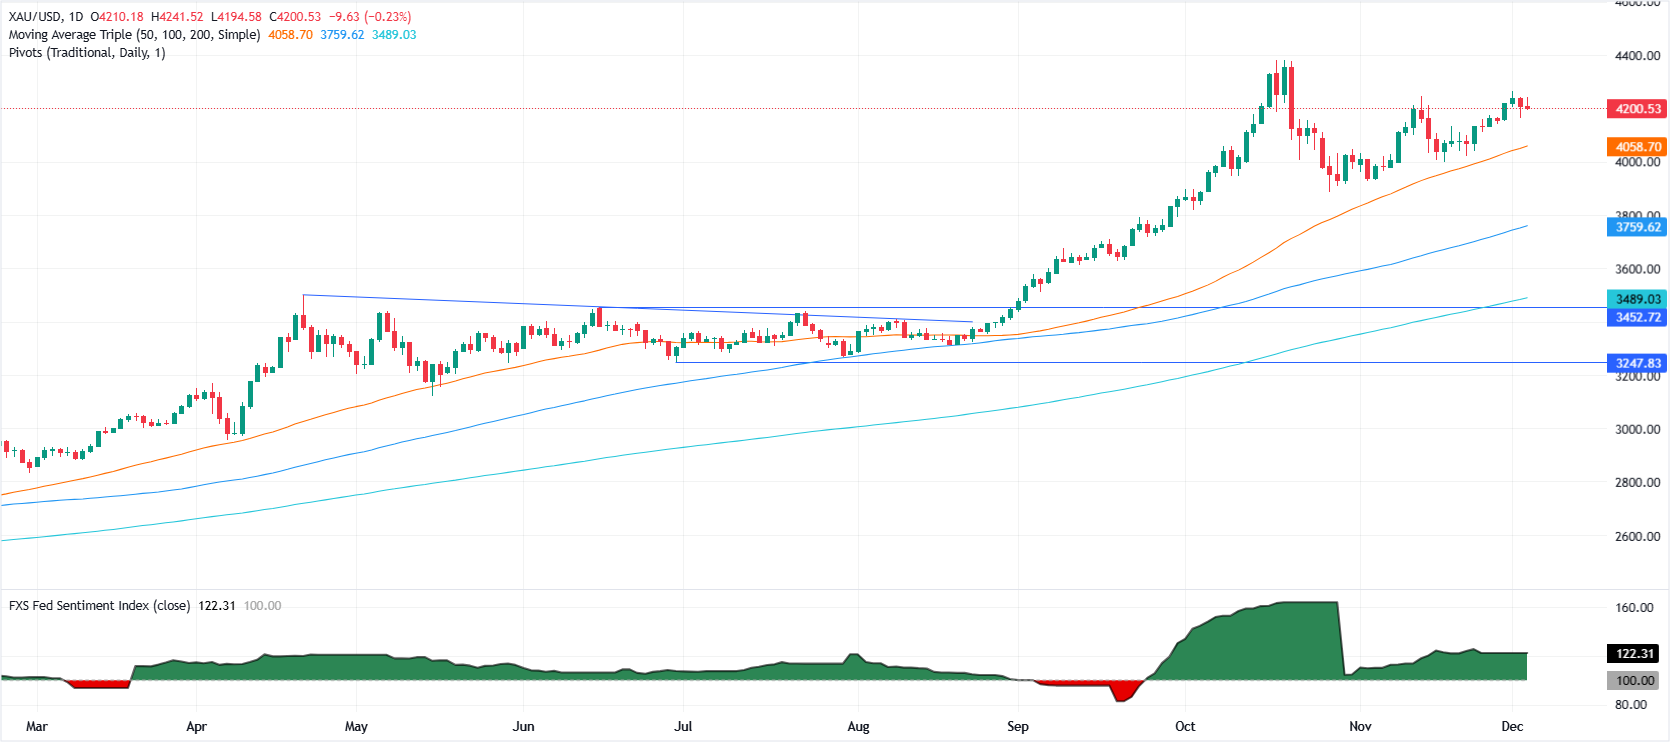
Technical analysis: Gold hovers around $4,200 awaiting a catalyst
Gold’s uptrend is intact, but a daily close below $4,200 increases the chances of challenging lower prices. The Relative Strength Index (RSI), although bullish, shifted slightly flat, an indication of consolidation as traders wait for a fresh catalyst.
If XAU/USD rallies past $4,250, it opens the door to test $4,300, ahead of the record high at $4,381. Otherwise, if Gold tumbles below $4,200, the next support is the 20-day Simple Moving Average (SMA) at $4,113, ahead of $4,100.
Gold FAQs
Gold has played a key role in human’s history as it has been widely used as a store of value and medium of exchange. Currently, apart from its shine and usage for jewelry, the precious metal is widely seen as a safe-haven asset, meaning that it is considered a good investment during turbulent times. Gold is also widely seen as a hedge against inflation and against depreciating currencies as it doesn’t rely on any specific issuer or government.
Central banks are the biggest Gold holders. In their aim to support their currencies in turbulent times, central banks tend to diversify their reserves and buy Gold to improve the perceived strength of the economy and the currency. High Gold reserves can be a source of trust for a country’s solvency. Central banks added 1,136 tonnes of Gold worth around $70 billion to their reserves in 2022, according to data from the World Gold Council. This is the highest yearly purchase since records began. Central banks from emerging economies such as China, India and Turkey are quickly increasing their Gold reserves.
Gold has an inverse correlation with the US Dollar and US Treasuries, which are both major reserve and safe-haven assets. When the Dollar depreciates, Gold tends to rise, enabling investors and central banks to diversify their assets in turbulent times. Gold is also inversely correlated with risk assets. A rally in the stock market tends to weaken Gold price, while sell-offs in riskier markets tend to favor the precious metal.
The price can move due to a wide range of factors. Geopolitical instability or fears of a deep recession can quickly make Gold price escalate due to its safe-haven status. As a yield-less asset, Gold tends to rise with lower interest rates, while higher cost of money usually weighs down on the yellow metal. Still, most moves depend on how the US Dollar (USD) behaves as the asset is priced in dollars (XAU/USD). A strong Dollar tends to keep the price of Gold controlled, whereas a weaker Dollar is likely to push Gold prices up.
Recommended Articles


