

Bitcoin Weekly Forecast: BTC steadies as data suggests local bottom
- Bitcoin price steadies around $91,000 on Friday after recovering nearly 5% so far this week.
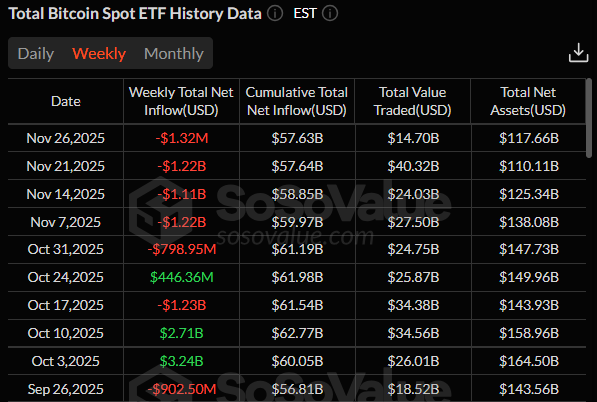
- US-listed spot ETFs saw a modest outflow of $1.32 million until Wednesday in a shortened week due to Thanksgiving day in the US, marking a slowdown from previous weeks.
- On-chain data suggests BTC may have formed a local bottom, supported by a strong rebound and accumulation among certain whale cohorts.
Bitcoin (BTC) hovers around $91,000 at the time of writing on Friday, extending its recovery by 5% so far this week. On the institutional front, a modest outflow from US-listed spot Bitcoin Exchange Traded Funds (ETFs) marks a slowdown from previous weeks and signals a reduction in selling pressure, further supporting BTC’s recovery. Moreover, on-chain data suggest a potential local bottom formation, with renewed accumulation from selected whale groups supporting the recent price rebound.
Bitcoin institutional demand records mild outflows
Institutional demand for Bitcoin shows a reduction in selling pressure compared to previous weeks. According to SoSoValue data, US-listed spot Bitcoin ETFs recorded a total outflow of $1.32 million until Wednesday in a shortened week due to the Thanksgiving day on Thursday, after a massive streak of outflows since the end of October. For BTC to continue its recovery, the ETF flows should turn positive and intensify.
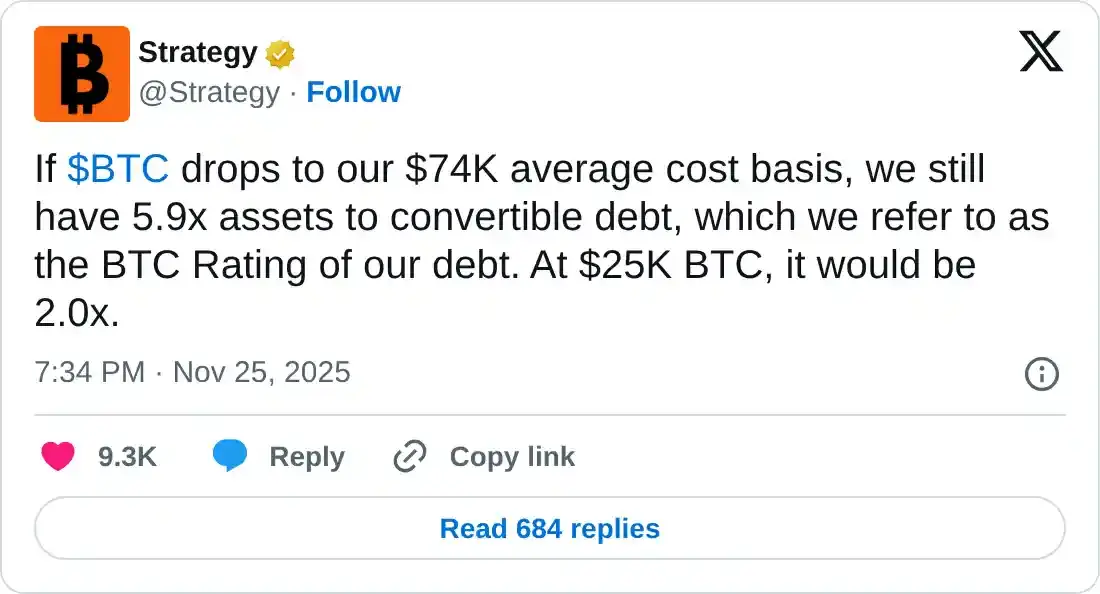
On Wednesday, Strategy stated on its official X account that even if Bitcoin drops to its average cost basis of $74,000, its BTC holdings would still cover its convertible debt by 5.9 times — a ratio the company refers to as its ‘BTC Rating’.
The firm added that at a BTC price of $25,000, the coverage would remain at 2 times, highlighting that it can easily cover its debts even if BTC crashes sharply.
Fed rate cut expectation boosts risk-off sentiment
Bitcoin started the week on a positive note, extending its weekend recovery and rising nearly 5% to trade above $91,000 on Friday. This price rebound was boosted by New York Federal Reserve President John Williams describing the current policy as modestly restrictive. Last Friday, Williams told reporters that he sees room for the central bank to lower rates in the near term.
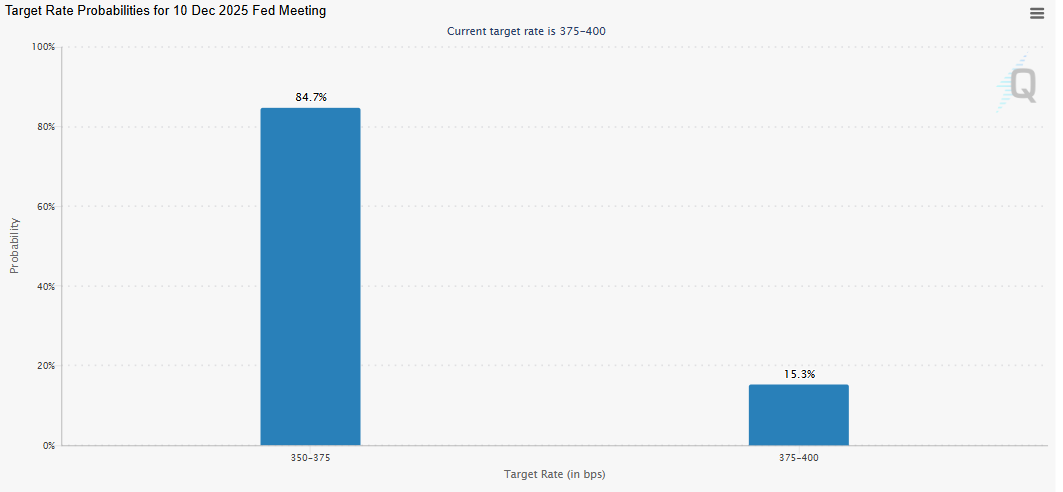
Market participants were quick to react and are now pricing in around an 85% chance that the Federal Reserve (Fed) will lower borrowing costs in December, according to the CME FedWatch tool shown in the chart below. This renewed optimism that the US central bank will cut interest rates again in December boosts investors' appetite for riskier assets such as Bitcoin.
Easing global tension boosts risk appetite
Bitcoin's price recovery was further boosted by easing tensions in the Russia-Ukraine war. On Thursday, Russian President Vladimir Putin broke his silence on a US-backed peace plan to end the war in Ukraine, saying Moscow is ready for “serious” discussions about the draft proposals, according to CNBC.
Putin said that the outlines of a fledgling peace plan reached by the US and Ukraine could serve as the basis for a deal to end the almost 4-year conflict.
“In general, we agree that this can be the basis for future agreements,” Putin said.
Mix signals from on-chain metrics
CryptoQuant data shows that mid-sized wallets holding 10-100 BTC and 100-1,000 BTC have been steadily accumulating, offering some support to the market, though not enough to offset the heavier selling pressure from the 1,000–10,000 BTC cohort, as shown in the graph below.
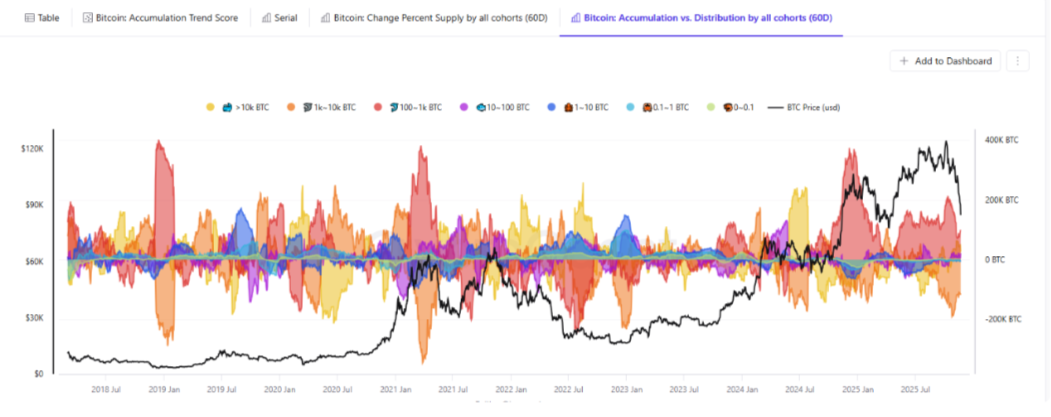
These large whales have continued to distribute, alongside retail investors (with 0–1 BTC and 1–10 BTC). Overall, BTC could have formed a potential local bottom, supported by a strong rebound and accumulation from the mid-sized wallets. However, persistent selling from the crucial 1,000–10,000 BTC group continues to limit confirmation of a broader trend reversal. The current price recovery is encouraging, but a decisive shift in whale behavior is still required to signal the end of the bearish phase.
Is BTC bottoming here?
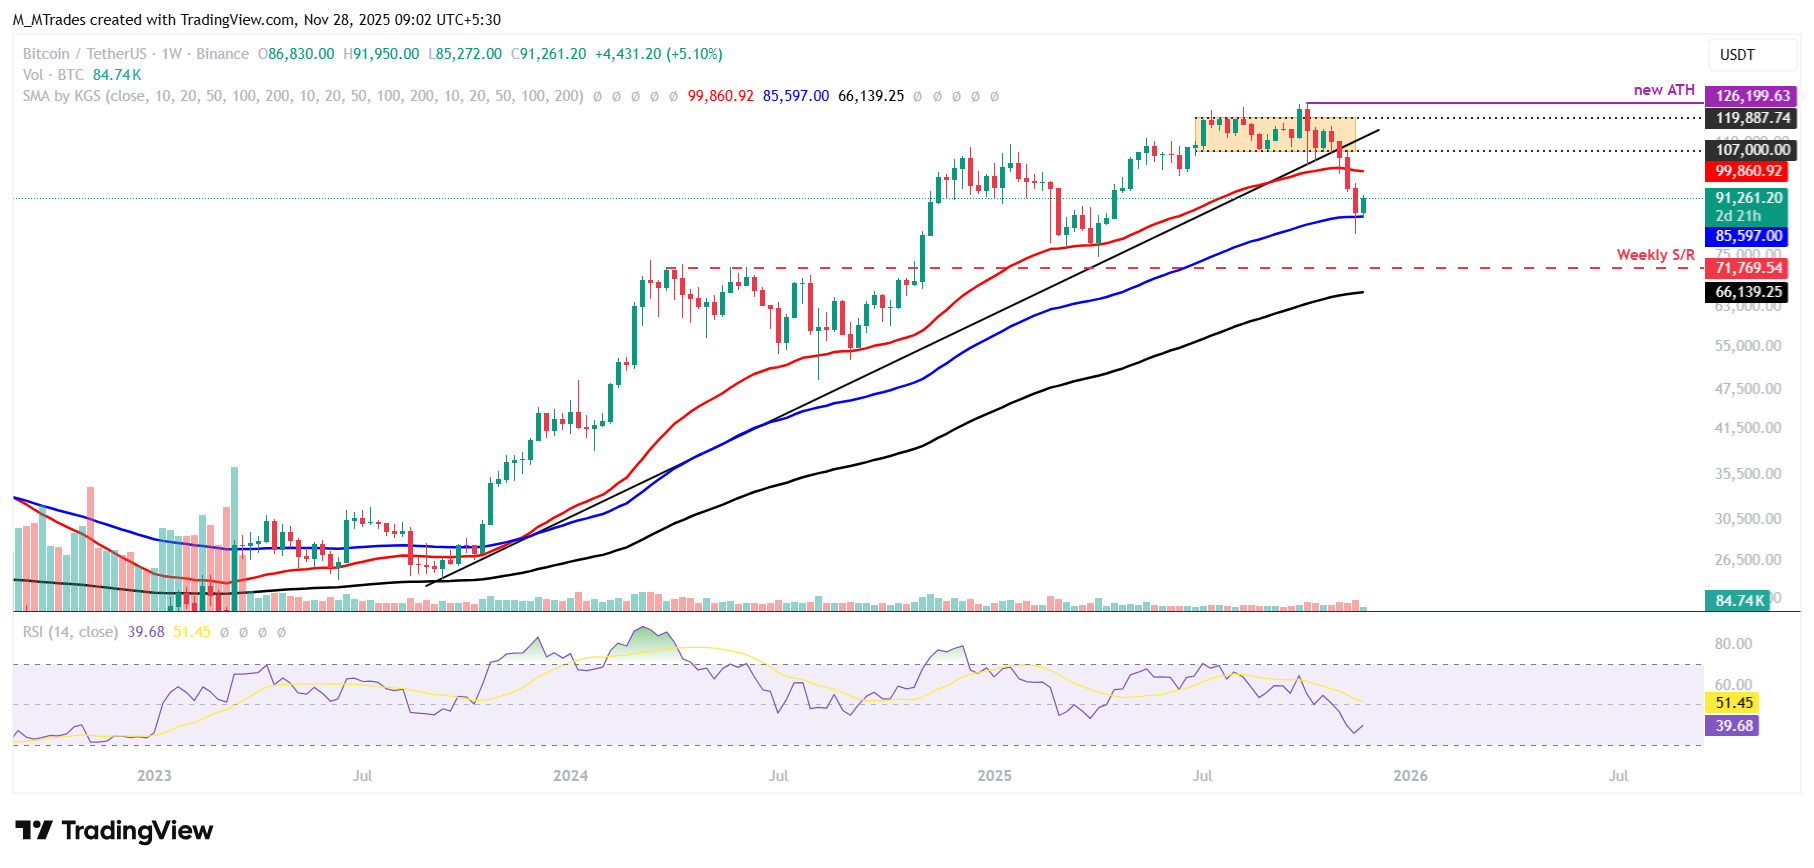
Bitcoin’s weekly chart shows it has found support around the 100-week Exponential Moving Average (EMA) at $85,597 after a four-week correction since the end of October. At the time of writing on Friday, BTC hovers around $91,200, recovering 5% so far this week.
If BTC continues its recovery, it could extend the rally toward the 50-week EMA at $99,860.
The Relative Strength Index (RSI) on the weekly chart reads 39, pointing upward and indicating fading bearish momentum. For the recovery rally to be sustained, the RSI must move above the neutral level of 50.
On the daily chart, Bitcoin price found support roughly around the key psychological level of $80,000 last week.
If BTC continues its recovery, it could extend the rally toward the next key psychological level at $100,000, which roughly coincides with the 50-day EMA and the 50% Fibonacci retracement from the April low to the all-time high set in October.
The RSI on the daily chart rises to 40, nearing the neutral 50 level and also indicating fading bearish momentum. Additionally, the Moving Average Convergence Divergence (MACD) indicator showed a bullish crossover on Thursday, providing a buy signal and further supporting the potential continuation of the recovery.
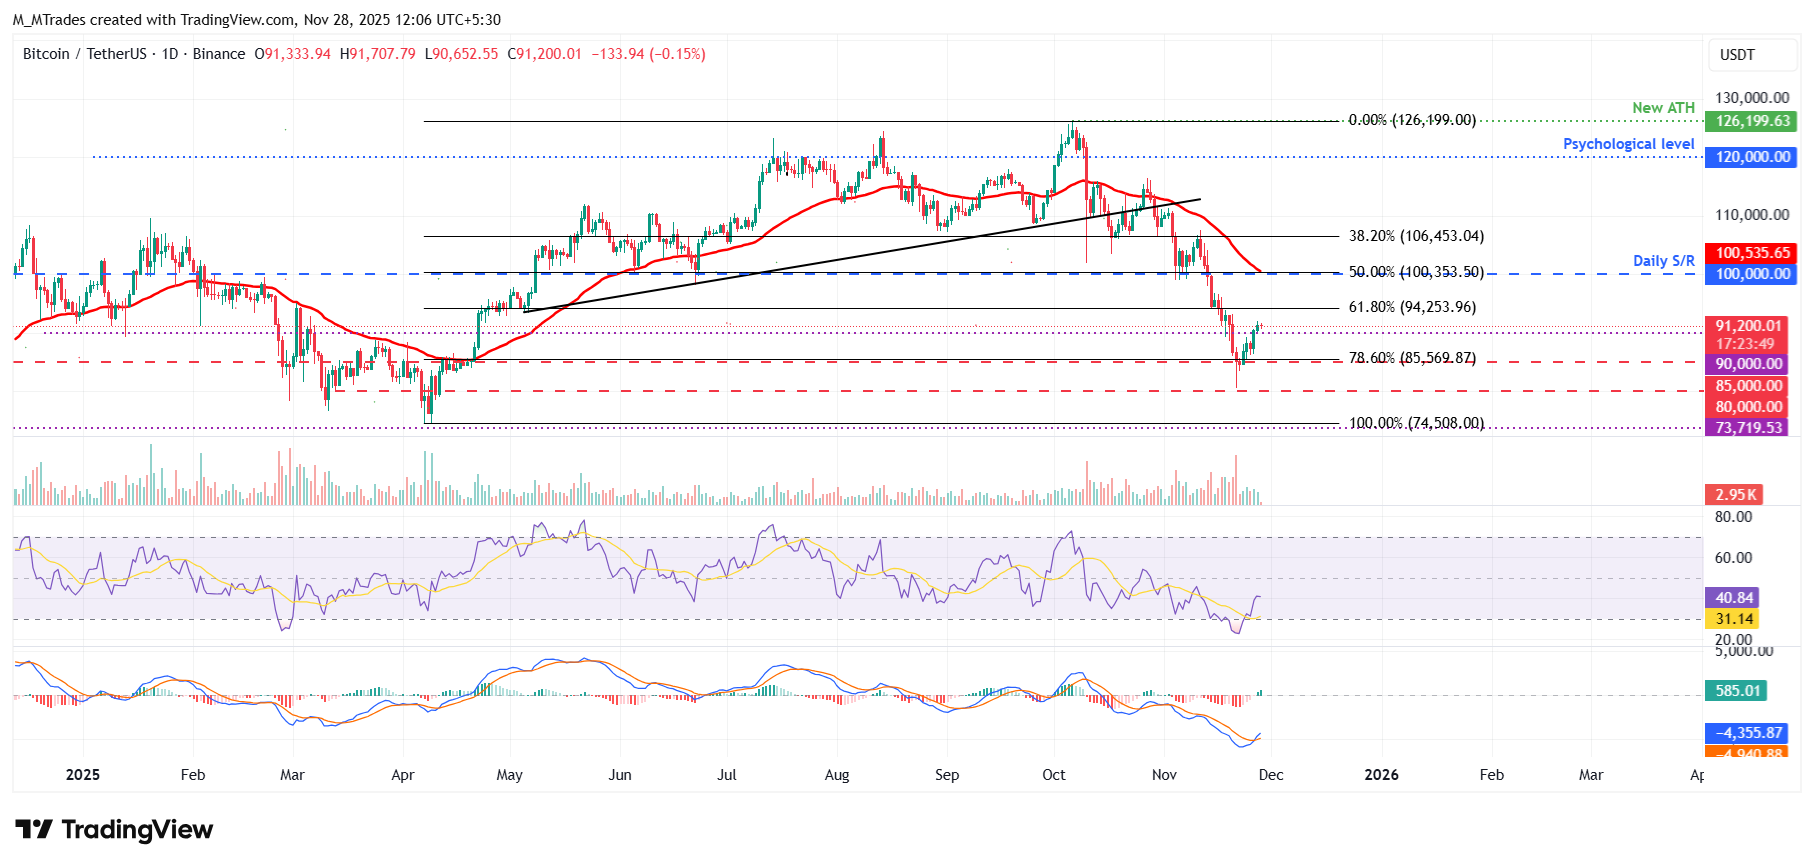
On the other hand, if BTC faces a correction, it could extend the decline toward the key support at $85,000.
Bitcoin, altcoins, stablecoins FAQs
Bitcoin is the largest cryptocurrency by market capitalization, a virtual currency designed to serve as money. This form of payment cannot be controlled by any one person, group, or entity, which eliminates the need for third-party participation during financial transactions.
Altcoins are any cryptocurrency apart from Bitcoin, but some also regard Ethereum as a non-altcoin because it is from these two cryptocurrencies that forking happens. If this is true, then Litecoin is the first altcoin, forked from the Bitcoin protocol and, therefore, an “improved” version of it.
Stablecoins are cryptocurrencies designed to have a stable price, with their value backed by a reserve of the asset it represents. To achieve this, the value of any one stablecoin is pegged to a commodity or financial instrument, such as the US Dollar (USD), with its supply regulated by an algorithm or demand. The main goal of stablecoins is to provide an on/off-ramp for investors willing to trade and invest in cryptocurrencies. Stablecoins also allow investors to store value since cryptocurrencies, in general, are subject to volatility.
Bitcoin dominance is the ratio of Bitcoin's market capitalization to the total market capitalization of all cryptocurrencies combined. It provides a clear picture of Bitcoin’s interest among investors. A high BTC dominance typically happens before and during a bull run, in which investors resort to investing in relatively stable and high market capitalization cryptocurrency like Bitcoin. A drop in BTC dominance usually means that investors are moving their capital and/or profits to altcoins in a quest for higher returns, which usually triggers an explosion of altcoin rallies.
Recommended Articles


