


EUR/USD Price Forecast: Extends recovery above 1.1200 at US Dollar’s expense
- EUR/USD jumps to near 1.1220 at the expense of the US Dollar.
- Hot US CPI data fails to lift hawkish Fed expectations.
- Heightened French fiscal concerns are likely to keep the Euro under pressure.
The Euro (EUR) is up 0.5% at around 1.1220 against the US Dollar (USD) during the early European trading session on Thursday after extending is Wednesday’s recovery move. The major currency pair recovers further as the US Dollar underperforms due to a sharp decline in United States (US) Treasury Yields, following the release of the Consumer Price Index (CPI) data for September
US Dollar Price Today
The table below shows the percentage change of US Dollar (USD) against listed major currencies today. US Dollar was the weakest against the Swiss Franc.
| USD | EUR | GBP | JPY | CAD | AUD | NZD | CHF | |
|---|---|---|---|---|---|---|---|---|
| USD | -0.48% | -0.38% | -0.22% | -0.13% | 0.34% | -0.36% | -0.59% | |
| EUR | 0.48% | 0.09% | 0.27% | 0.32% | 0.84% | 0.10% | -0.12% | |
| GBP | 0.38% | -0.09% | 0.17% | 0.23% | 0.72% | 0.01% | -0.22% | |
| JPY | 0.22% | -0.27% | -0.17% | 0.06% | 0.57% | -0.18% | -0.39% | |
| CAD | 0.13% | -0.32% | -0.23% | -0.06% | 0.48% | -0.21% | -0.45% | |
| AUD | -0.34% | -0.84% | -0.72% | -0.57% | -0.48% | -0.70% | -0.94% | |
| NZD | 0.36% | -0.10% | -0.01% | 0.18% | 0.21% | 0.70% | -0.25% | |
| CHF | 0.59% | 0.12% | 0.22% | 0.39% | 0.45% | 0.94% | 0.25% |
The heat map shows percentage changes of major currencies against each other. The base currency is picked from the left column, while the quote currency is picked from the top row. For example, if you pick the US Dollar from the left column and move along the horizontal line to the Japanese Yen, the percentage change displayed in the box will represent USD (base)/JPY (quote).
At press time, the US Dollar Index (DXY), which tracks gauges the Greenback’s value against six major currencies, trades 0.6% lower to near 101.90. 10-year US Treasury Yields have slid to near 5.10%, the lowest level seen in three weeks.
The data showed on Wednesday that the headline inflation accelerated at a faster-than-expected pace to 3.7% Year-on-Year (YoY) from 3.4% in August. The core CPI – which excludes volatile food and energy items – arrived at 2.6% YoY, higher than 2.5% estimates and the previous reading of 2.4%.
Despite the US CPI growing at a stronger-than-projected, it failed to lift hawkish Fed expectations. The CME FedWatch tool shows that the odds of the Fed hiking interest rates in the policy meeting later this meeting have increased marginally to 27% from 22% seen before the data release.
On the Euro front, French fiscal risks due to ballooning public debt are expected to keep the currency under pressure. 10-year French bond yields remain higher at around 4.86%, closer to its decades high of 5% posted earlier this month.
EUR/USD Technical Analysis
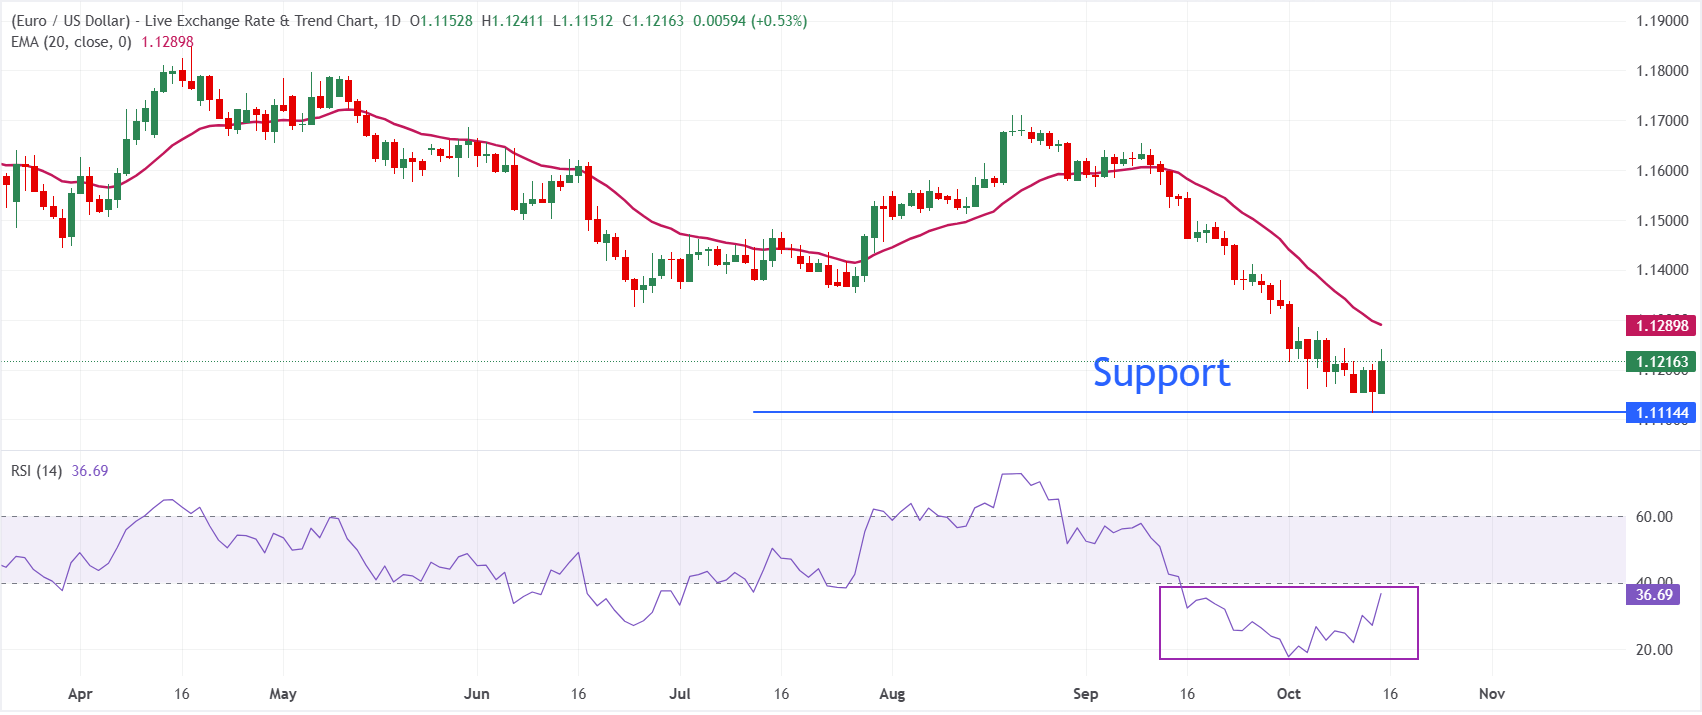
In the daily chart, EUR/USD trades at 1.1220, retaining a bearish near-term bias as it holds below the 20-period exponential moving average (EMA) at 1.1290.
The pair has been sliding steadily from the 1.16 area, and while the Relative Strength Index (RSI) has recovered to around 36, it still suggests only modest improvement after oversold conditions, leaving the broader tone capped beneath the short-term EMA.
On the topside, immediate resistance is located at the 20-period EMA at 1.1290, which acts as the first barrier that bulls would need to reclaim to ease downside pressure. Looking down, the pair would exposed to the psychological level of 1.1000 if it fails to hold the October 14 low at 1.1114.
(The technical analysis of this story was written with the help of an AI tool. Know more.)
Economic Indicator
Consumer Price Index (YoY)
Inflationary or deflationary tendencies are measured by periodically summing the prices of a basket of representative goods and services and presenting the data as The Consumer Price Index (CPI). CPI data is compiled on a monthly basis and released by the US Department of Labor Statistics. The YoY reading compares the prices of goods in the reference month to the same month a year earlier.The CPI is a key indicator to measure inflation and changes in purchasing trends. Generally speaking, a high reading is seen as bullish for the US Dollar (USD), while a low reading is seen as bearish.
Read more.Last release: Wed Oct 14, 2026 12:30
Frequency: Monthly
Actual: 3.7%
Consensus: 3.6%
Previous: 3.4%
Source: US Bureau of Labor Statistics
The US Federal Reserve (Fed) has a dual mandate of maintaining price stability and maximum employment. According to such mandate, inflation should be at around 2% YoY and has become the weakest pillar of the central bank’s directive ever since the world suffered a pandemic, which extends to these days. Price pressures keep rising amid supply-chain issues and bottlenecks, with the Consumer Price Index (CPI) hanging at multi-decade highs. The Fed has already taken measures to tame inflation and is expected to maintain an aggressive stance in the foreseeable future.
Recommended Articles


