


AUD/USD Price Forecast: Declining 20-day EMA builds case for more downside
- AUD/USD ticks up to near 0.6960 as the US Dollar faces pressure.
- A drop in US bond yields has led to some correction in the US Dollar.
- Investors keenly await the CPI data from the US and China, and the Australian employment data.
The Australian Dollar (AUD) is marginally higher at around 0.6960 against the US Dollar (USD) during the European trading session on Tuesday. The Aussie pair edges up as the US Dollar comes under pressure due to a decline in United States (US) Treasury Yields ahead of the Consumer Price Index (CPI) data for September, which will be released on Wednesday.
US Dollar Price Today
The table below shows the percentage change of US Dollar (USD) against listed major currencies today. US Dollar was the weakest against the Japanese Yen.
| USD | EUR | GBP | JPY | CAD | AUD | NZD | CHF | |
|---|---|---|---|---|---|---|---|---|
| USD | -0.19% | -0.11% | -0.22% | -0.08% | -0.04% | -0.17% | -0.18% | |
| EUR | 0.19% | 0.07% | -0.05% | 0.13% | 0.12% | 0.04% | 0.00% | |
| GBP | 0.11% | -0.07% | -0.13% | 0.00% | 0.05% | -0.04% | -0.06% | |
| JPY | 0.22% | 0.05% | 0.13% | 0.15% | 0.19% | 0.07% | 0.06% | |
| CAD | 0.08% | -0.13% | -0.00% | -0.15% | 0.04% | -0.08% | -0.09% | |
| AUD | 0.04% | -0.12% | -0.05% | -0.19% | -0.04% | -0.11% | -0.14% | |
| NZD | 0.17% | -0.04% | 0.04% | -0.07% | 0.08% | 0.11% | -0.01% | |
| CHF | 0.18% | -0.00% | 0.06% | -0.06% | 0.09% | 0.14% | 0.00% |
The heat map shows percentage changes of major currencies against each other. The base currency is picked from the left column, while the quote currency is picked from the top row. For example, if you pick the US Dollar from the left column and move along the horizontal line to the Japanese Yen, the percentage change displayed in the box will represent USD (base)/JPY (quote).
As of writing, the US Dollar Index (DXY), which gauges the Greenback’s value against six major currencies, is down 0.16% to near 102.40. Still, the DXY is close to its fresh yearly high of 102.61 posted on Monday. 10-year US bond yields trade 0.85% lower to near 5.20%.
The US CPI report is expected to show that the headline inflation accelerated to 3.7% Year-on-Year (YoY) from 3.4% in August. The core CPI – which excludes volatile items such as food and energy – is seen higher at 2.5% YoY from the previous reading of 2.4%.
Investors will pay close attention to the US CPI data as it is expected to influence Federal Reserve’s (Fed) interest rate expectations. Currently, the CME FedWatch tool show traders are confident that the Fed will leave interest rates unchanged in the policy meeting later this month.
On the Australian Dollar front, investors await China’s CPI and Australian employment data for September, which are scheduled for Wednesday and Thursday, respectively.
AUD/USD Technical Analysis
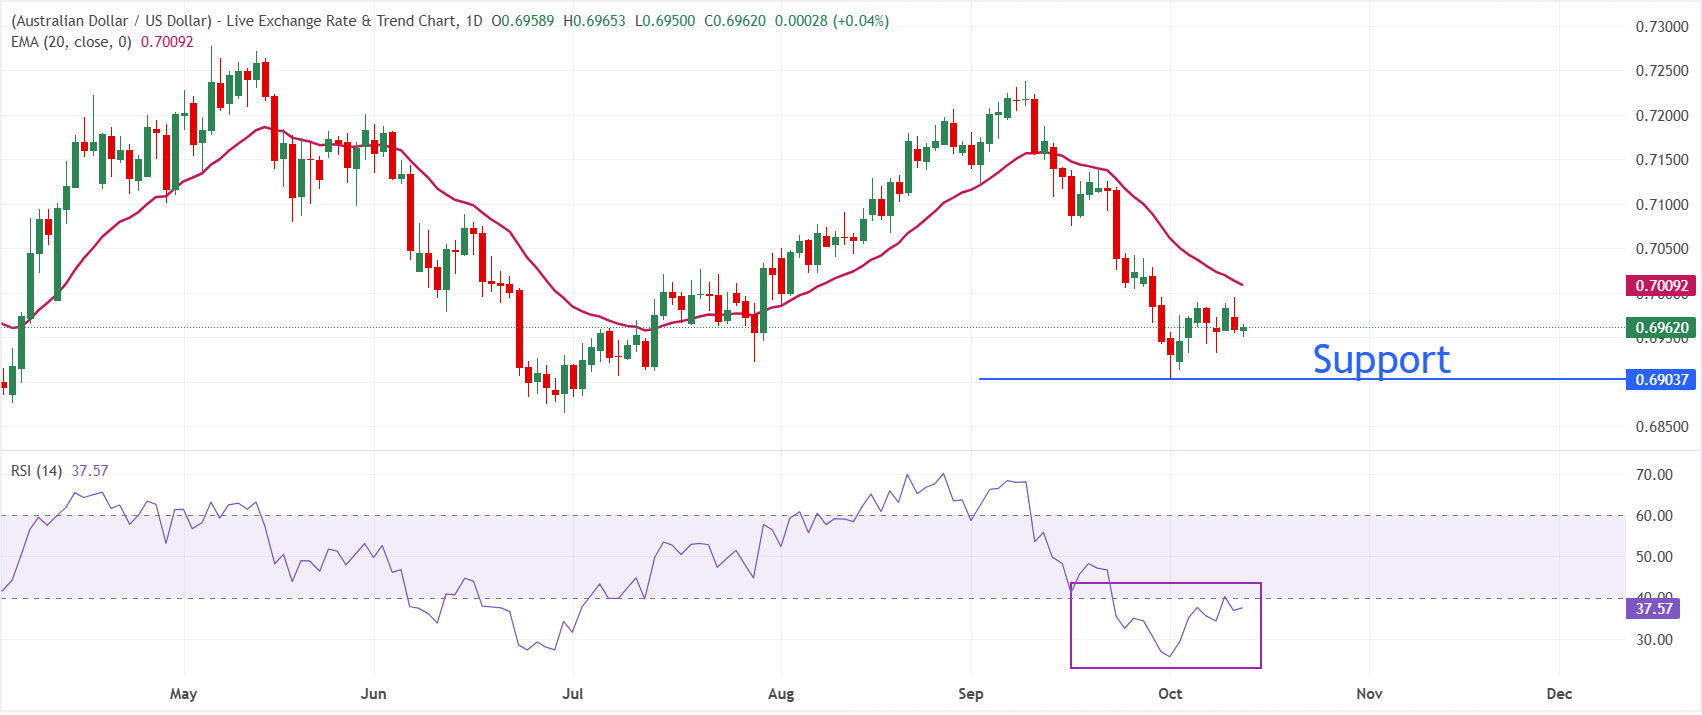
In the daily chart, AUD/USD trades at 0.6960, keeping a bearish near-term tone as spot holds beneath the 20-day exponential moving average (EMA) at 0.7009. The pair’s inability to reclaim this short-term trend indicator suggests rallies remain capped for now, while the Relative Strength Index (14) at 37.6 stays below neutral territory, hinting at lingering downside pressure rather than outright oversold conditions.
On the topside, initial resistance is located at the 20-day EMA at 0.7009, and a sustained break above this level would be needed to ease immediate bearish pressure and open the way for a more constructive recovery phase. On the downside, the October 1 lo at 0.6904 is the key support level; a decisive break below the same would expose the pair to the June low at 0.6865.
(The technical analysis of this story was written with the help of an AI tool. Know more.)
Economic Indicator
Employment Change s.a.
The Employment Change released by the Australian Bureau of Statistics is a measure of the change in the number of employed people in Australia. The statistic is adjusted to remove the influence of seasonal trends. Generally speaking, a rise in Employment Change has positive implications for consumer spending, stimulates economic growth, and is bullish for the Australian Dollar (AUD). A low reading, on the other hand, is seen as bearish.
Read more.Next release: Thu Oct 15, 2026 00:30
Frequency: Monthly
Consensus: 20K
Previous: 39.5K
Source: Australian Bureau of Statistics
Recommended Articles


