


Gold Price Analysis Today | Forex Gold Analysis | XAU/USD Analysis - October 13, 2026


Today's Gold Price
Gold price chart for today
*0% Commission and Low Spreads 0️⃣
*$50,000 in Free Virtual Funds 💰
*$100 New Customer Bonus 🎁
Gold (XAU/USD) traded around $4,157 this morning (October 13, 2026; B.E. 2569), pressured by a dollar at an 18-month high and a 10-year Treasury yield holding at an elevated 5.24%. Markets have raised the probability they assign to a Federal Reserve rate increase in December to 87.7% ahead of this week's CPI report. Still, 23 consecutive months of gold purchases by China's central bank and record inflows into gold ETFs have helped support prices. The key question today is whether gold can hold above support at $4,134–4,143 and preserve its recovery base.
Today's Key Points
| Key Points |
|
|
|
Markets weigh a December Fed rate increase as oil tops $106 and Treasury yields stay elevated
Gold weakened as the dollar strengthened and the 10-year Treasury yield held above 5.24%. The 30-year yield reached 5.60%, reflecting the higher returns investors demand to compensate for U.S. fiscal and debt risks. Meanwhile, tensions in the Strait of Hormuz lifted Brent crude to $106.65 a barrel, fueling concern that energy inflation could accelerate again.
Inflation concerns have led markets to raise the probability of a December Fed rate increase to 87.7%, increasing the opportunity cost of holding gold. David Morrison of Trade Nation said gold may need to test a key support base to reset its momentum. Fawad Razaqzada of FOREX.com said the rebound was losing steam under pressure from the dollar and Treasury yields.
Dollar's 18-month high weighs on gold ahead of CPI, while PBOC buying and ETF demand remain strong
The dollar's rise to an 18-month high has pushed gold back toward support. Ricardo Evangelista of ActivTrades described the move as a short-term reaction to the economic calendar ahead of Wednesday's CPI report and Thursday's PPI report. If inflation slows, he said, pressure from the dollar could ease quickly.
Over the longer term, however, the People's Bank of China (PBOC) added 740,000 ounces of gold in September, extending its buying streak to 23 months. Global gold ETFs also recorded a record $31 billion of inflows in the third quarter, indicating that investors continue to hold gold as a hedge against currency depreciation.
Invesco says gold has withstood multidecade highs in Treasury yields, with structural demand supporting the longer-term outlook
Invesco said gold showed resilience by ending the third quarter up 3.7% at $4,157, even as U.S. 10-year and 30-year Treasury yields reached 5.28% and 5.63%, respectively, their highest levels since 2002. It said the relationship between gold and real yields has weakened since 2022 as central banks worldwide have accumulated bullion regardless of price.
U.S. public debt exceeding $40 trillion has also heightened market concern about fiscal risks. Although Invesco warned that the fourth quarter could be volatile if investors sell gold to meet margin calls in equities, it said gold's structural value and central-bank demand remain strong longer-term supports.



Technical Analysis of Gold (XAU/USD)
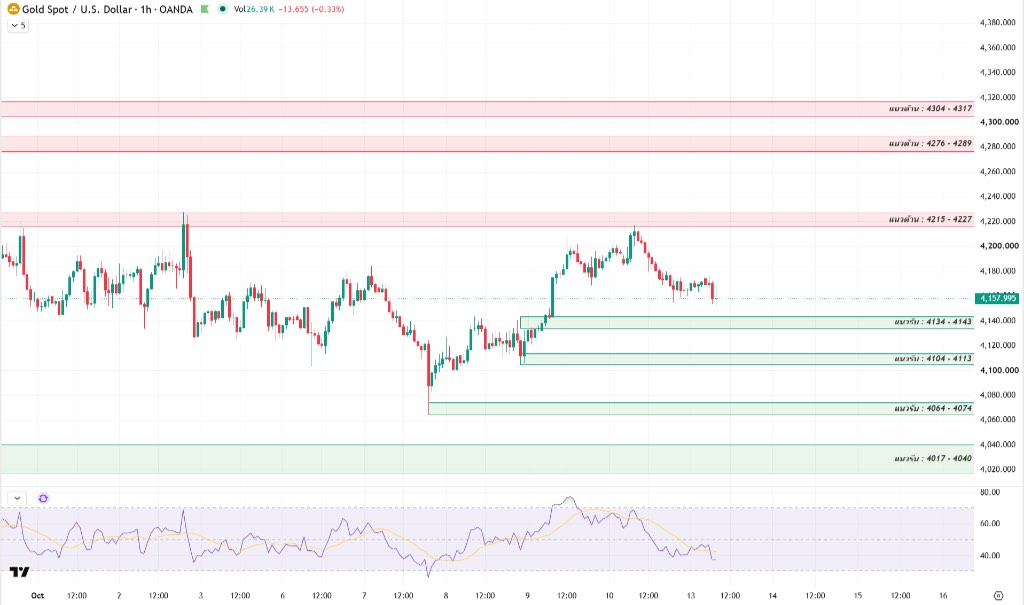
On the one-hour chart, gold has fallen to test initial support at $4,134–4,143 after profit-taking around resistance at $4,215–4,227. This support area is important for absorbing selling pressure and establishing a new price base.
The RSI (14) has fallen below 50 and was recently around 38–40, suggesting that buying momentum has slowed and sellers are beginning to dominate the short-term market. As the RSI approaches oversold territory, however, a countertrend bounce could occur while support is tested.
The key condition today is for gold to hold above $4,134–4,143 and rebound to form a higher low. That would confirm a base and strengthen the case for reclaiming the first resistance zone.
If gold holds initial support and breaks above resistance at $4,215–4,227, it could recover toward $4,276–4,289 and then $4,304–4,317. A break below $4,134, however, would increase the risk of a decline to the next support zones at $4,104–4,113 and $4,064–4,074.
Today's Gold Price Outlook
| Scenarios |
|
|
|
Today's Trading Strategy
Short-term traders should approach range trading cautiously, watch the market's response near support at $4,134–4,143, and avoid chasing prices until a clear higher-low base has formed.
Buy setup: Consider an entry if gold retests support at $4,134–4,143 and shows a clear recovery, with a stop-loss below $4,128 and a potential profit target around $4,215–4,227.
Sell setup: Consider an entry if gold rebounds toward resistance at $4,215–4,227 but fails to break through, or if it falls below $4,134. A stop-loss above $4,235 would accompany a potential target at $4,104–4,113.
For longer-term investors, structural support from central-bank buying remains strong. Wait for gold to build a base above the main support area at $4,064–4,104 before gradually accumulating physical bullion.
Daily Support and Resistance Levels
| Type | Price Level |
| Support #1 | $4,134–4,143 |
| Support #2 | $4,104–4,113 |
| Support #3 | $4,064–4,074 |
| Resistance #1 | $4,215–4,227 |
| Resistance #2 | $4,276–4,289 |
| Resistance #3 | $4,304–4,317 |
Today's Questions (FAQ)
Why has the dollar's rise to an 18-month high weighed on gold prices?
Because gold is priced in dollars, a stronger dollar makes it more expensive for holders of other currencies. Elevated Treasury yields have also prompted some investors to reduce holdings of non-interest-bearing assets and hold dollars in the short term ahead of the inflation reports.
Why does Invesco see gold as resilient despite Treasury yields reaching multidecade highs?
Invesco said gold's relationship with real yields has weakened since 2022 because central banks worldwide have been buying bullion to diversify reserves regardless of price. U.S. debt exceeding $40 trillion has also encouraged investors to hold gold to preserve value.
This English translation was prepared with the assistance of AI tools. Please refer to the original Thai article for the source content.
Read more
The above content was completed with the assistance of AI and has been reviewed by an editor.


